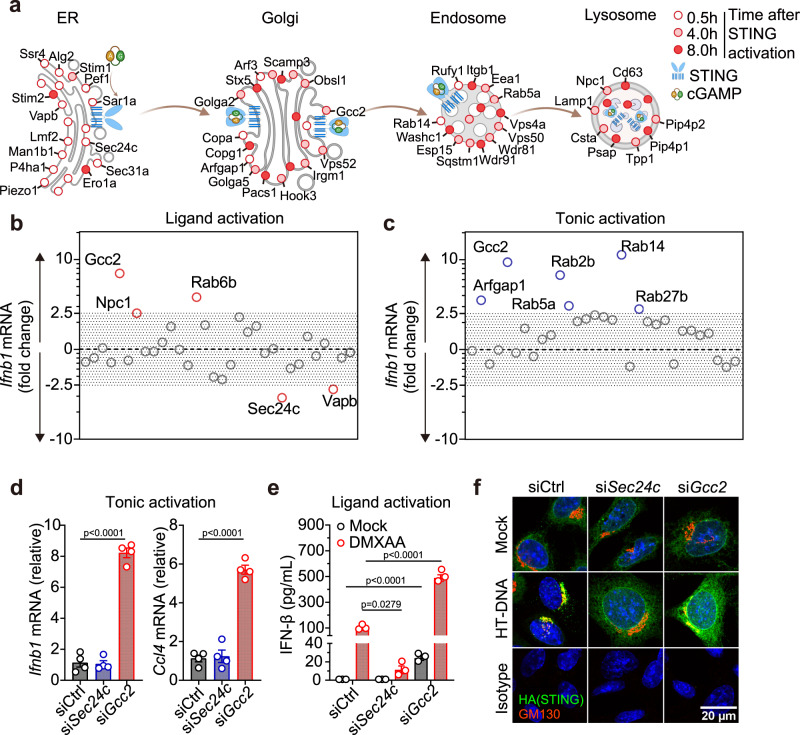
Fig. 1. Knockdown of STING post-Golgi cofactors activates tonic IFN signaling.
a A spatiotemporal map of selected STING cofactor candidates identified in the primary proteomic screen. Open, half-filled and filled circles indicate cofactors identified at 0.5 h, 4 h and 8 h after STING activation, respectively. b lfnb1 mRNA expression in ligand activation assay and tonic activation assay c. Wild-type MEFs were transfected with specific siRNA against each of the 31 selected candidate cofactors. Then, knockdown cells were either simulated with HT-DNA (1 µg/mL, 4 h) then qRT-PCR for Ifnb1 expression b or directly measured Ifnb1 expression without stimulation c. Fold-changes were determined by normalizing to control siRNA in either assay. Primary data are shown in Supplementary Fig. 1. d qRT-PCR analysis of resting-state lfnb1 and Ccl4 (an ISG) mRNA expression after control, Sec24c or Gcc2 siRNA knockdown in wild-type MEFs. n = 4. e ELISA analysis of mouse IFN-β in the supernatant after control, Sec24c or Gcc2 siRNA knockdown followed by DXMAA stimulation (50 µM, 8 h). n = 3. f Confocal microscopy images of STING colocalization with Golgi. StingKO MEFs stably expressing HA-STING were transfected with control, Sec24c or Gcc2 siRNA followed by mock or HTDNA stimulation (1 µg/mL, 1.5 h). HA-STING in green, GM130 (a Golgi marker) in red and DAPI in blue. Scale bar, 20 µm. Data are representative of at least three independent experiments. Data (d and e) are shown as mean ± s.e.m. P values were determined by One-way ANOVA.

