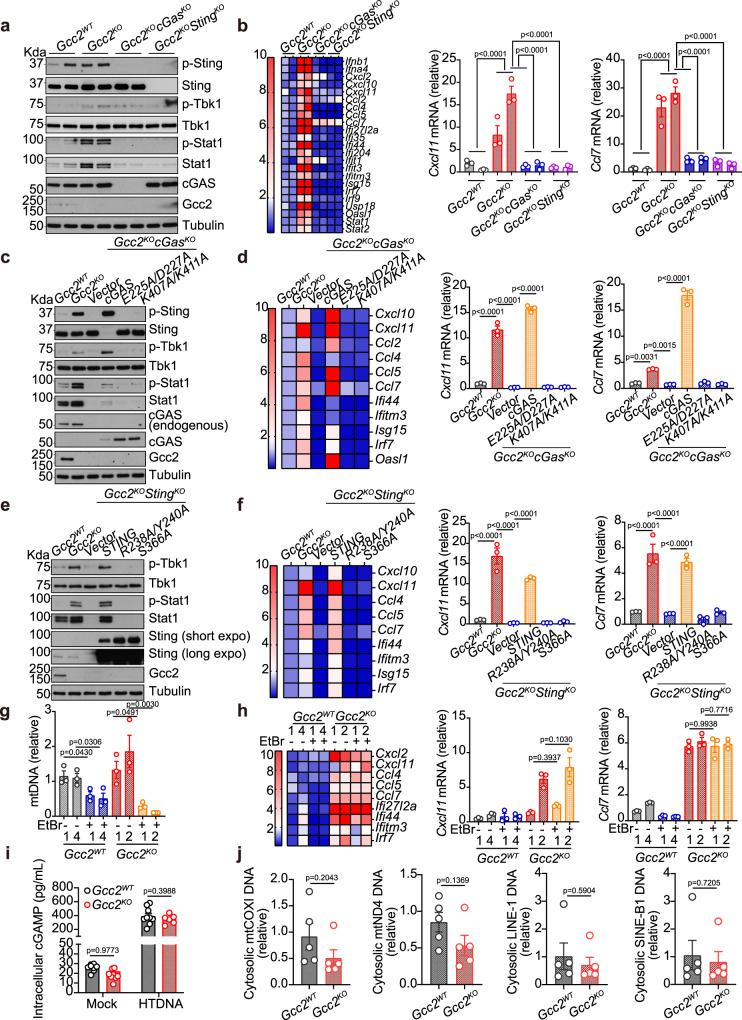
Fig. 4. Both cGAS and STING are required for tonic IFN signaling in Gcc2-KO cells.
a, b Western Blot (a) and qRT-PCR (b) analysis of tonic IFN signaling in Gcc2WT, Gcc2KO, Gcc2KOSTINGKO, and Gcc2KOcGASKO MEFs. Two independent CRISPR/Cas9 knockout clones of each genotype are included. p-Sting, p-Tbk1, and p-Stat1 are key phosphorylation events of the STING signaling pathway (a). Expression of IFN genes and ISGs are shown in a heatmap (b, left) and representative bar graphs (b, right). n = 3. c, d Western Blot (c) and qRT-PCR (d) analysis of tonic IFN signaling in Gcc2WT, Gcc2KO, Gcc2KOcGASKO MEFs reconstituted with vector control, wild-type cGAS, E225A/D227A cGAS (enzymatic-dead mutant), K407A/K411A cGAS (DNA-binding mutant). Cells were analyzed as in a, b. n = 3. e, f Western Blot (e) and qRT-PCR (f) analysis of tonic IFN signaling in Gcc2WT, Gcc2KO, Gcc2KOSTINGKO MEFs reconstituted with vector control, wild-type STING, R238A/Y240A STING (ligand-binding mutant), S366A STING (IFN signaling mutant). Cells were analyzed as in a, b. n = 3. g, h qPCR analysis of mtDNA content (g) and qRT-PCR analysis of tonic IFN signaling (h) in two independent clones of Gcc2WT, Gcc2KO with or without mtDNA depletion by EtBr. n = 3. i Intracellular cGAMP level in Gcc2WT and Gcc2KO cells mock treated or stimulated with HT-DNA. n = 8. j qPCR analysis of indicated cytoplasmic DNA species in Gcc2WT and Gcc2KO cells. n = 5. Data are representative of at least three independent experiments. Data (b, d, f, and g–j) are shown as mean ± s.e.m. P values were determined by one-way ANOVA (b, d, f, and g–j).

