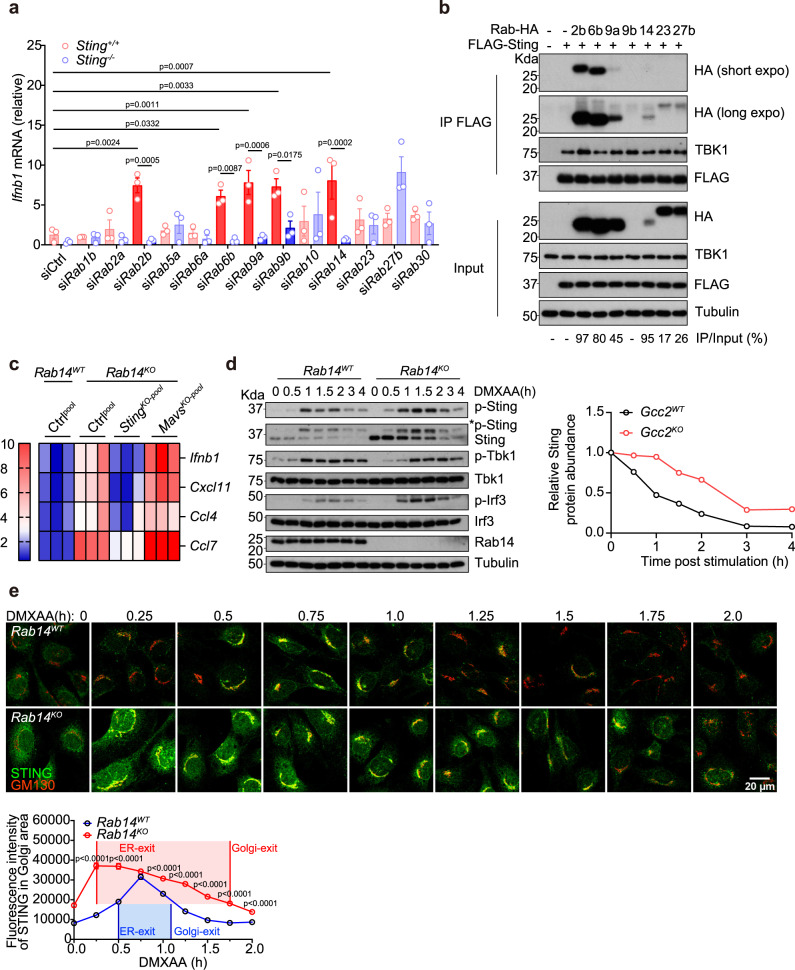
Fig. 6. RAB14 and other Rabs mediate STING post-Golgi trafficking.
a qRT-PCR analysis of tonic Ifnb1 mRNA expression in StingWT or StingKO MEFs after siRNA knockdown of indicated Rab GTPases (bottom). Solid red bars indicate siRNAs that induce STING-dependent IFN signaling. n = 3. b Co-immunoprecipitation analysis of STING:Rab interaction. HEK293T cells were transfected with FLAG-Sting and various HA-Rab GTPases (as indicated on top), IP with the FLAG antibody and blotted with indicated antibody on the right. Percentages of IP/Input are shown on the bottom. Note the expression level of Rab14 plasmid is low in whole cell lysate but IP/Input% is high. c A heatmap showing expression of ISGs in Rab14WT, Rab14KO, Rab14KOStingKO-pool, and Rab14KOMavsKO-pool MEFs. Bar graphs are shown in Supplementary Fig. 7g. d Western blot analysis of STING signaling kinetics in Rab14WT and Rab14KO MEFs. Cells were stimulated with DMXAA (10 µg/mL) for indicated times (top) and blotted for total- and phosphor-proteins as indicated on the right. Quantification of relative Sting protein abundance (normalized to Tubulin, then set 0 h value to 1) are shown on the right. e Confocal microscopy analysis of endogenous STING trafficking in Rab14WT and Rab14KO MEFs. Cells were stimulated with DMXAA (10 µg/mL) and analyzed as in Fig. 2g. Endogenous STING in green and GM130 (a Golgi marker) in red. Scale bar, 20 µm. n = 3. Data are representative of at least three independent experiments. At least 37 cells in two different views were analyzed (e). Data (a and e) are shown as mean ± s.e.m. P values are determined by One-way ANOVA (a) or by Two-way ANOVA (e).

