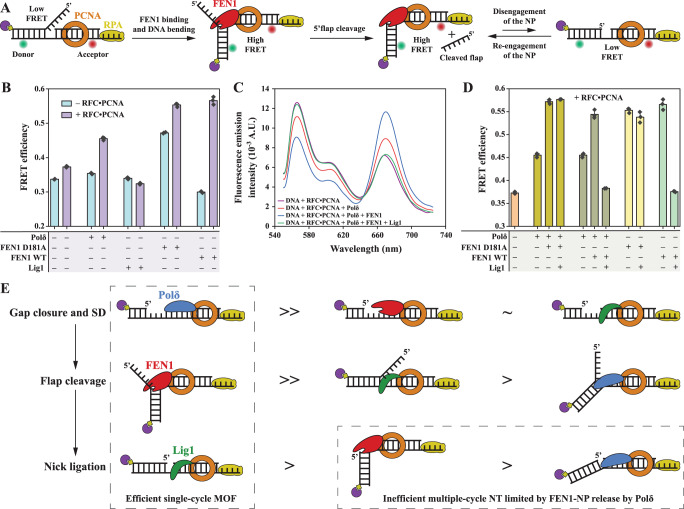
Fig. 2. Substrate hand-offs among MOF proteins.
A Cartoon representation of the internal-labeling scheme used to monitor flap and NP engagement. B Apparent FRET efficiencies of the double flap (Sub#12; Supplementary Fig. 7) upon addition of individual MOF proteins in the presence and absence of RFC•PCNA. The bar chart illustrates the mean (as bar height) and one standard deviation (as error bar) of three independent measurements. C Examples of emission spectra of the internally labeled double flap (Sub#12) upon addition of various combinations of MOF proteins. D Apparent FRET efficiencies of the internally labeled double flap (Sub#12) upon the addition of various combinations of MOF proteins in the presence of RFC•PCNA. The bar chart illustrates the mean (as bar height) and one standard deviation (as error bar) of three independent measurements. Conditions for panels B–D: 15 nM FEN1, 250 nM Polδ, 500 nM Lig1. E Cartoon representations of the various affinities of MOF proteins to intermediate DNA structures. For each intermediate DNA substrate, the affinity is decreasing from left to right. » denotes much higher affinity, > denotes higher affinity, and ~ denotes similar affinity. Source data are provided as a Source Data file.

