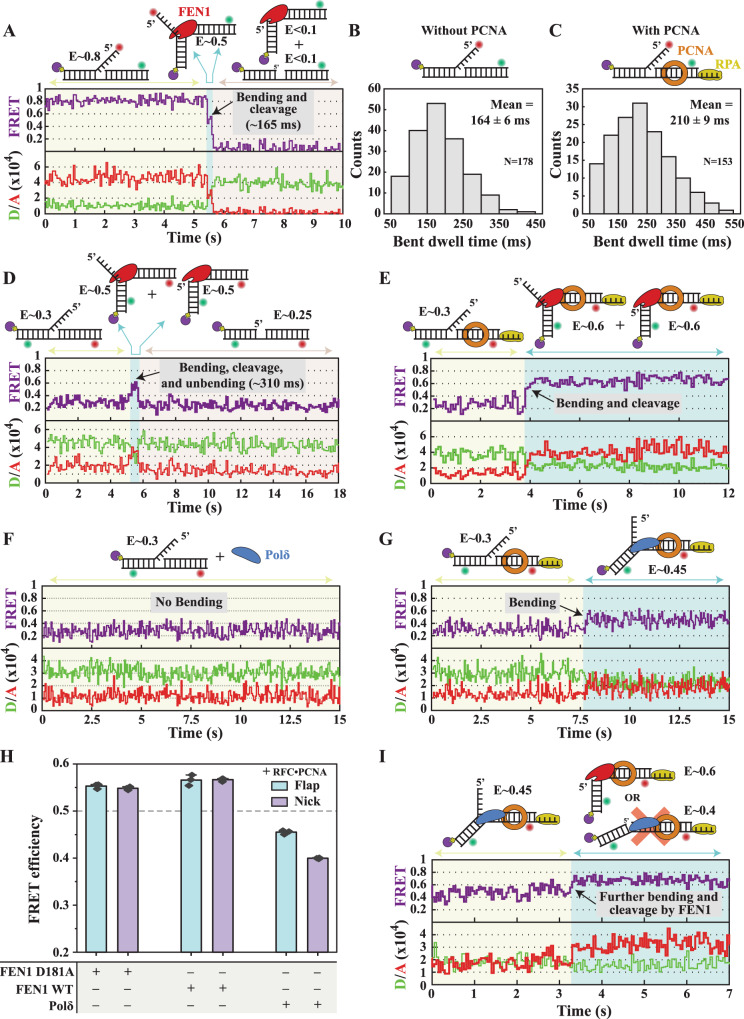
Fig. 3. Monitoring substrate hand-offs between FEN1 and Polδ at the single-molecule level.
A Representative single-molecule cleavage time trace of the double flap (Sub#23; Supplementary Fig. 7) by FEN1 (250 nM) through the flap labeling scheme at 50 ms temporal resolution. B, C Histograms of the distributions of dwell times of the bent conformer before cleavage from the flap labeling scheme in the (B) absence (Sub#23) and (C) presence (Sub#22; Supplementary Fig. 7) of pre-loaded PCNA. The indicated mean and error of the dwell time distributions represent the raw arithmetic mean and standard error of the mean of the raw datapoints that were binned into the histograms, without additional histogram fitting. Representative single-molecule cleavage time trace of the double flap by FEN1 (250 nM) through the internal-labeling scheme in the (D) absence (Sub#13; Supplementary Fig. 7) and (E) presence (Sub#12; Supplementary Fig. 7) of pre-loaded PCNA at 100 ms temporal resolution. Flap cleavage must have occurred in <3 frames. Representative single-molecule bending time trace of the double flap by Polδ (250 nM) through the internal-labeling scheme in the (F) absence (Sub#13) and G presence (Sub#12) of pre-loaded PCNA at 50 ms temporal resolution. H Apparent FRET efficiencies of the internally labeled double flap and NP (Sub#12 and Sub#24; Supplementary Fig. 7) upon addition of FEN1 D181A, FEN1 WT, or Polδ (250 nM each) in the presence of RFC•PCNA determined from bulk steady-state fluorescence measurements. The bar chart illustrates the mean (as bar height) and one standard deviation (as error bar) of three independent measurements. I Representative single-molecule time trace showing the hand-off of the double flap (Sub#12) from Polδ (250 nM) to FEN1 (250 nM) in the presence of pre-loaded PCNA at 50-ms temporal resolution. Flap cleavage must have occurred in <5 frames after FEN1 engagement. Source data are provided as a Source Data file.

