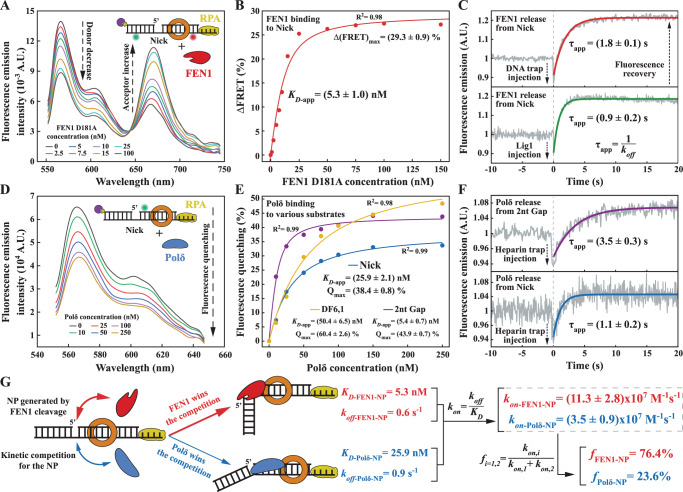
Fig. 5. Kinetic competition between FEN1 and Polδ for the NP.
A Fluorescence emission spectra of internal labeled NP (Sub#24; Supplementary Fig. 7) in the presence of pre-loaded PCNA at various concentrations of FEN1 D181A. B Quantification of the data presented in panel A. The experimental datapoints were fitted to a dependence proportional to Eq. (1) (“Methods”). C Fluorescence recovery of the Cy3 donor presented in panel A upon addition of a large excess of FEN1 DNA trap (top; 5 µM of unlabeled phosphotiolated nonequilibrating double flap; Sub#31; Supplementary Fig. 7) or Lig1 (bottom; 2 µM). The experimental datapoints were fitted to Eq. (2) (“Methods”). D Fluorescence emission spectra of Cy3-labeled NP (Sub#28; Supplementary Fig. 7) in the presence of pre-loaded PCNA at various concentrations of Polδ. E Quantification of the data presented in panel D and of similar experiments in which the NP was replaced with either a 2-nt gap (Sub#29; Supplementary Fig. 7) or a double flap (Sub#27; Supplementary Fig. 7). F Fluorescence recovery of the Cy3 donor presented in panel D, upon addition of a large excess of Polδ chemical trap (20 ng/µL of heparin) for the 2-nt gap (top; Sub#29) and the NP (bottom; Sub#28) substrates. The experimental datapoints were fitted to a dependence proportional to Eq. (1) (“Methods”). G Cartoon representation of the kinetic competition between FEN1 and Polδ for the NP from association rate perspective. Association rates (kon) were determined from dissociation constants (KD) and rates (koff) based on the indicated equation. The fi = 1, 2 coefficients represent the engagement probabilities of the NP by FEN1 and Polδ, respectively, based on their association rates and the indicated equation. Source data are provided as a Source Data file.

