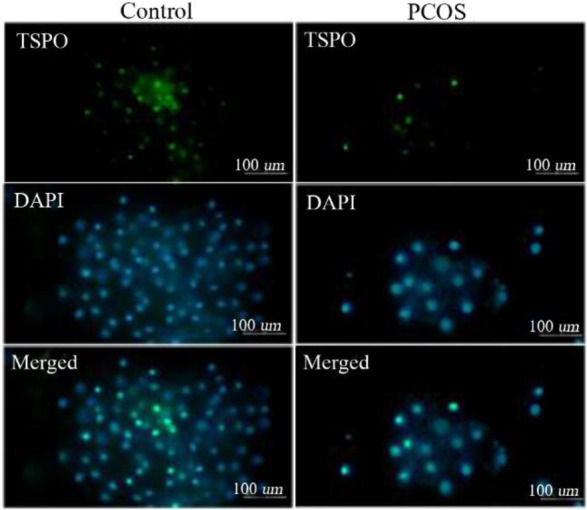
Figure 2.

TSPO protein levels were obtained by immunocytochemistry where green fluorescence intensities indicated cytoplasmic TSPO and blue DAPI fluorescence showed nuclear counterstain. Green and blue intensities were merged to obtain intensity ratio of green/blue fluorescence corresponding to the relative cytoplasmic TSPO levels and quantified with ImageJ software
