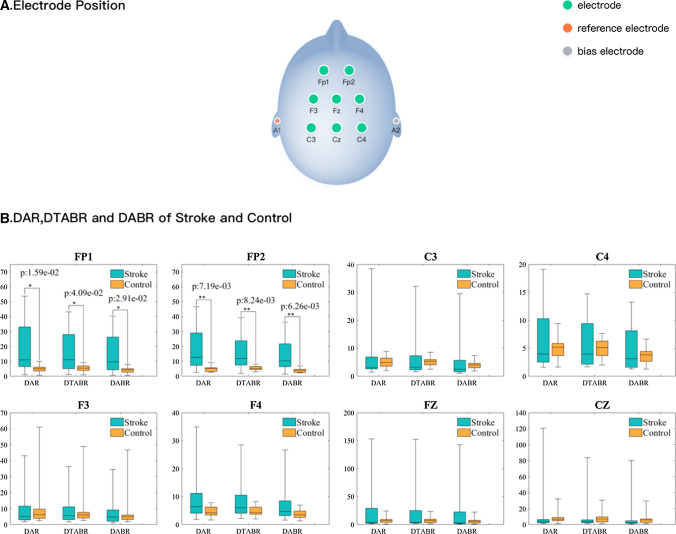
Fig. 3.
Electrode positions and comparison of DAR, DTABR and DABR values between the stroke subjects and healthy subjects. A Electrode positions B The comparative results of DAR, DTABR and DABR on FP1, FP2, F3, F4, C3, C4, FZ and CZ channels between the stroke group and the control group, respectively (turquoise represents the experimental group and yellow represents the control group). The center of the color block is the mean value, and the upper and lower sides of the box are third-quartile and first-quartile values. The top and bottom whiskers indicate the maximum and minimum values. *p < 0.05, **p < 0.01 indicates significant differences in comparison by Wilcoxon Signed Rank Test. When significant difference is found, p value is placed on the sign of significant difference

