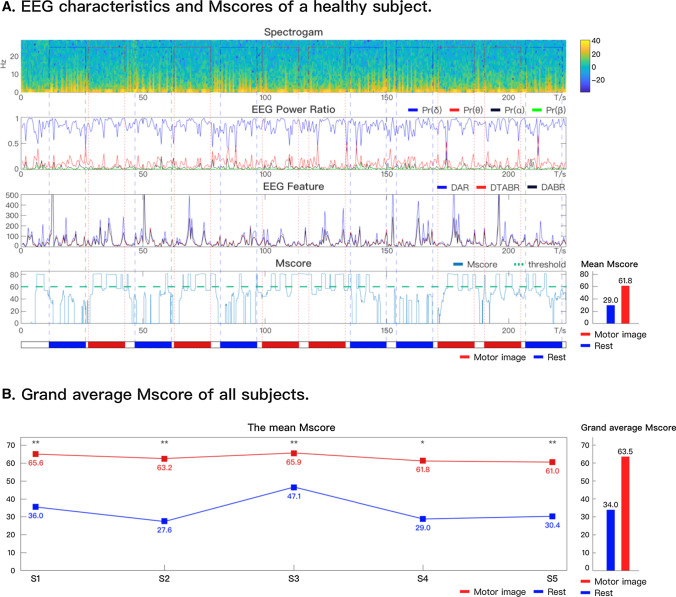
Fig. 4.
EEG characteristics and Mscore of FP1. A EEG characteristics and Mscores of a healthy subject. The subgraph with the title of Spectrogram represents the time–frequency EEG diagram for training of patients throughout the training process, with a color bar on the right; the subgraph with the title of EEG Power Ratio represent the power ratios of Delta, Theta, Alpha and Beta throughout the training process; the subgraph with the title of EEG Feature represent the changes of DAR, DTABR and DABR features in different states; the subgraph with the title of Mscore indicates the change of motor intention scores of patients in different states; the right part represents the specific representation of different colors of solid lines in the graph with the title of EEG Power Ratio, EEG Feature and Mscore; the bottom subgraph represents the state distribution throughout the training process, with red blocks representing motor imagery, blue blocks representing rest, and white blocks representing background throughout the training process, a total of 6 motor image and 6 rest were performed in each trials; segmentation between different states in subgraphs entitled Spectrogram, EEG Power Ratio, EEG Feature and Mscore by corresponding dashed lines. The average Mscore for rest and movement tasks is shown at the bottom right. B Grand average Mscore of all subjects. The mean Mscores represent the mean Mscores of each subject, and the grand average Mscore represents average Mscore of all subjects, with red blocks representing motor imagery, blue blocks representing rest. S* represent the subjects’ number. *p < 0.05, **p < 0.01 compared with the mean Mscore of rest; post-hoc Wilcoxon Signed Rank Test for the mean Mscore

