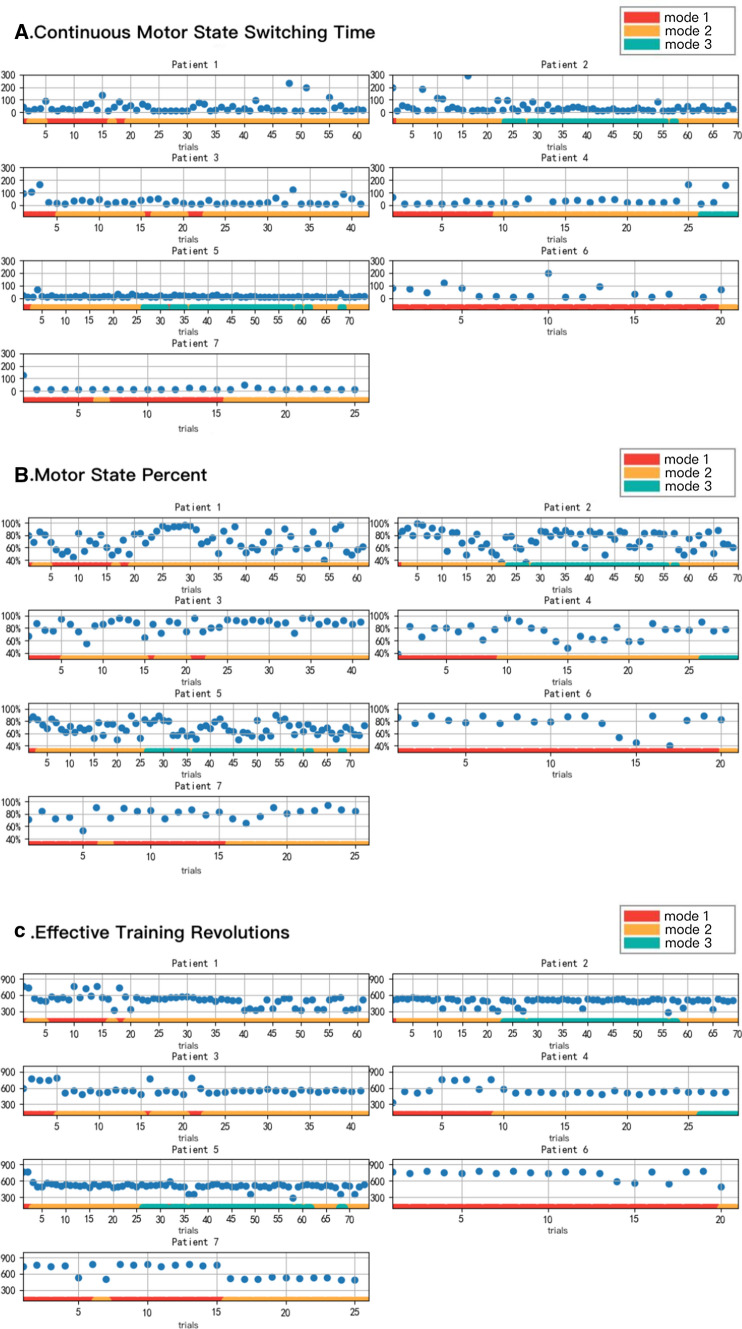
Fig. 8.
The evaluation of system usage. Red represents brain-controlled mode, yellow represents brain-controlled in robot-assistance mode, and green represents brain-controlled with robot resistance mode. A The box plot of the change in the continuous motor state switching time of 7 patients with an increase in the training times, the blue dots represent the continuous motor state switching time; B The box plot of the changes in the motor state percent of 7 patients with an increase in the training times, the blue dots represent the motor state percent; C The box plot of the changes in the effective training revolutions of 7 patients with an increase in the training times, the blue dots represent the effective training revolutions

