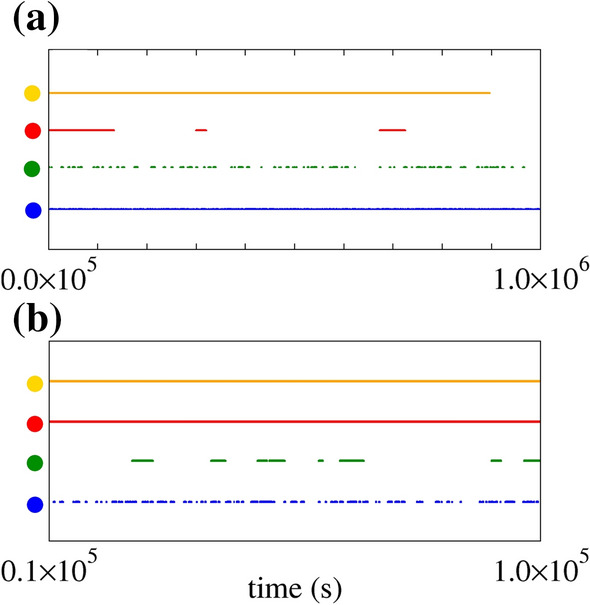
Fig. 11.

Raster plot for pA, Hz M (orange dots), Hz M (red dots), Hz M (green dots), and Hz M (blue dots). The panel (a) exhibits the entire time interval of spikes, while panel (b) the magnification in interval [0.1,1.0] s. The black dots exhibit a long initial burst activity, while the red, green, and blue dots show the neuronal activities with high variability. CV is larger for red dots than for green and blue dots. (Color figure online)
