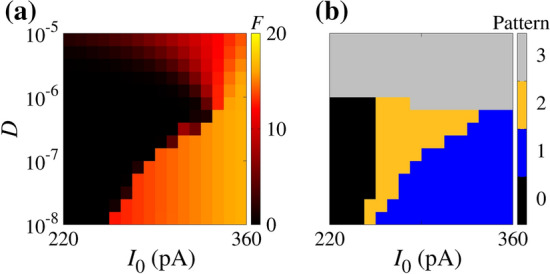
Fig. 5.

Parameter space for initial condition mV and . In panel (a), the colour bar corresponds to the values of F. The panel (b) displays the regions for the absence of spikes (black), continuous spikes (blue), a single spike train followed by silence activity (orange), and oscillatory activity between active and silence periods (gray). (Color figure online)
