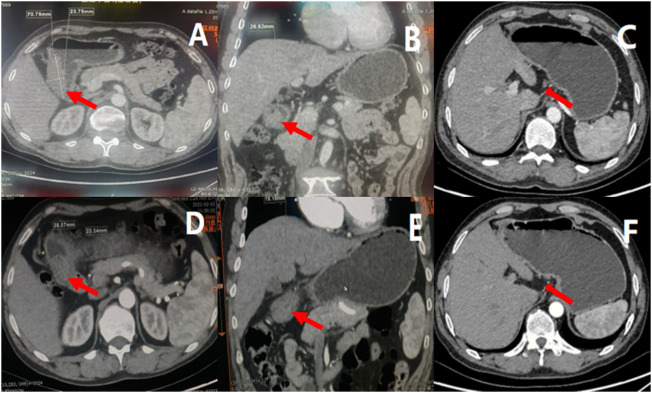
FIGURE 3.
Results of enhanced CT before and after neoadjuvant therapy, indicated tumor and lymph node volume decreased after three cycles of treatment. (A) showed the cross section of gastric antrum tumor before treatment, (B) showed the coronal view of gastric antrum tumor before treatment, (C) showed the enlarged lymph nodes before treatment; (D) showed the cross section of gastric antrum tumor after neoadjuvant treatment, (E) showed the coronal view of gastric antrum tumor after neoadjuvant treatment, (F) showed the enlarged lymph nodes after neoadjuvant treatment.

