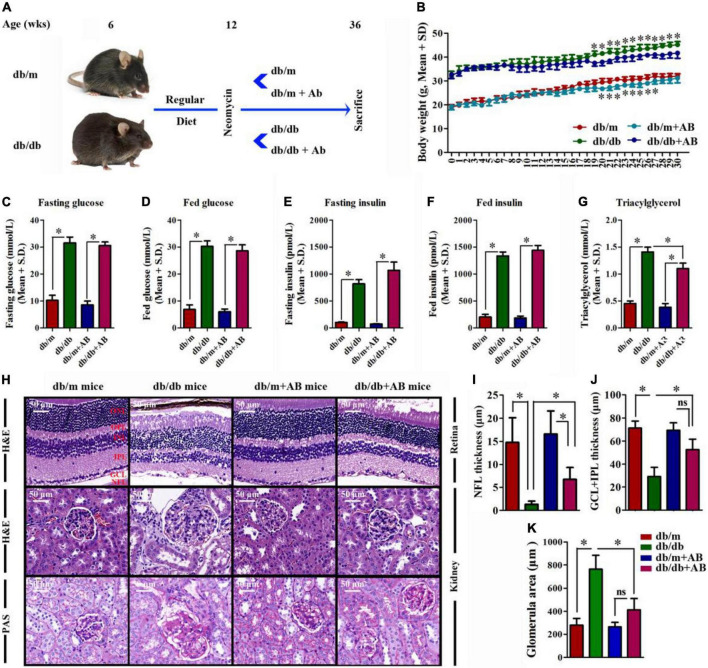
FIGURE 1.
The effect of obesity on metabolic variables exacerbated retinopathy and nephropathy. (A) Schematic representation of experimental timeline where half of the mice (Leprdb/db and Leprdb/m) start a regular diet (RD) at 6 weeks and later half of these receive neomycin (AB) treatment from the age of 12 weeks until killing at week 36. (B) Weight gain of AB-treated mice compared to control mice; Error bars represent mean ± S.D. n = 8 in per group. *P < 0.05. (C–G) The effect of obesity on metabolic variables including Blood glucose (C,D), insulin (E,F), and triacylglycerol (G) levels after 16 h of fasting (C,E), and in the random fed state (D,F) in mice with or without AB-treatment. n = 8 in per group. *P < 0.05. (H–K) HE staining was performed to detect vessels morphological changes of retinal sections (H, Upper) followed by quantitation of the thickness of NFL (I) and GCL + IPL (J). HE (H, Middle) and Periodic Acid-Schiff (PAS) (H, Bottom) staining was performed to detect glomerulus morphological changes of kidney sections followed by quantitation of the glomerular area (K). Error bars represent mean + S.D. n = 8 in per group. *P < 0.05.

