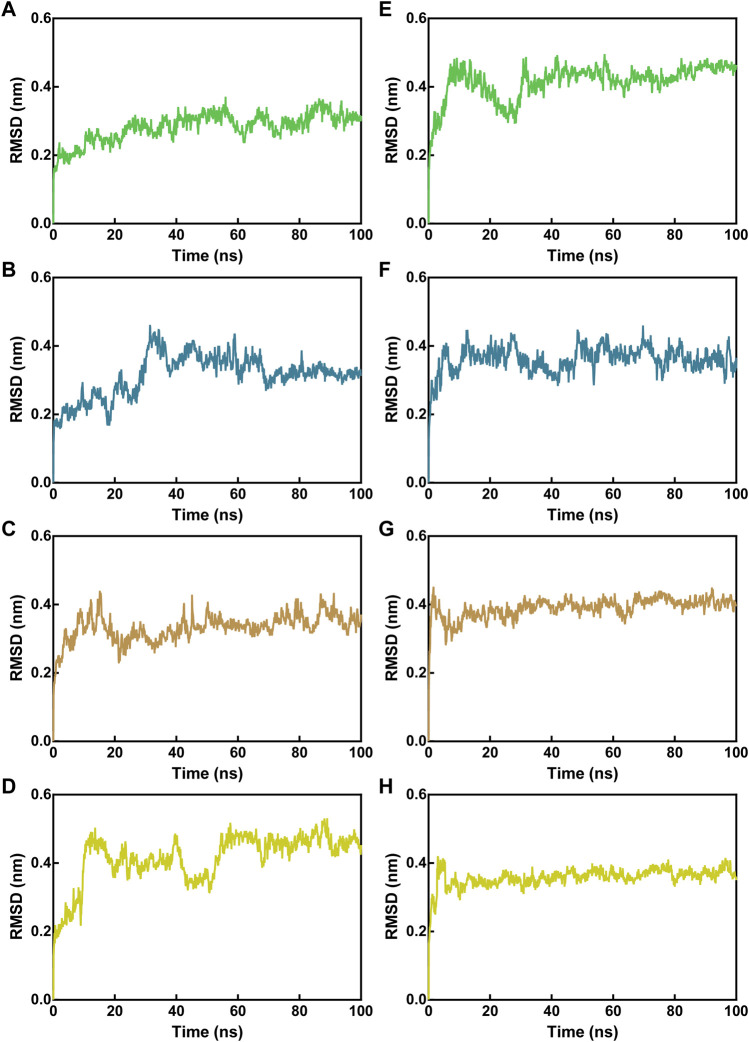
FIGURE 5.
RMSD of Cα atoms of Mpro-peptide and NRP1-peptide complex atoms with respect to the initial structures obtained from docking. (A–D) RMSD in Mpro-peptide complexes, and (E–H) RMSD in NRP1-peptide complexes. In all panels the color code is MN-1 (green), MN-2 (blue), MN-3 (brown), and MN-4 (yellow).

