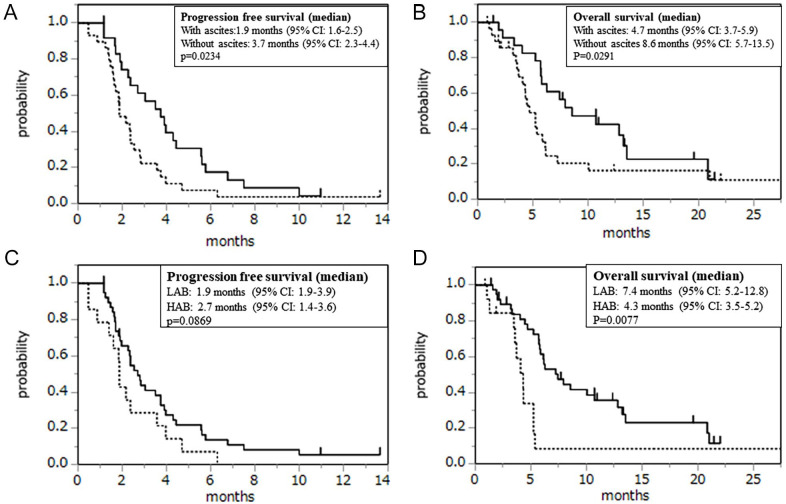
Figure 2.
Kaplan-Meier plots of (A) progression-free survival and (B) overall survival among study participants (the dotted line indicates the patient group with ascites; the normal line indicates the patient group without ascites). Kaplan-Meier plots of (C) progression-free survival and (D) overall survival among study participants (the dotted line indicates the patient group with HAB; the normal line indicates the patient group with LAB). HAB indicates high ascites burden; LAB, low ascites burden.

