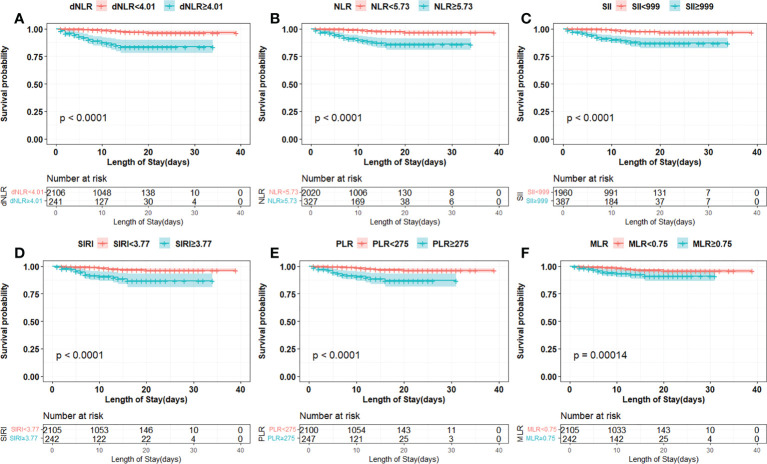
Figure 2.
Kaplan-Meier curves of inflammation indicators in COVID-19 Omicron BA.2 infected patients. (A–F) Kaplan-Meier curves of six inflammation indicators. (A) Derived neutrophil to lymphocyte ratio (dNLR), (B) neutrophil to lymphocyte ratio (NLR), (C) systemic immune-inflammation index (SII), (D) systemic inflammation response index (SIRI), (E) platelet to lymphocyte ratio (PLR), (F) monocyte to lymphocyte ratio (MLR).

