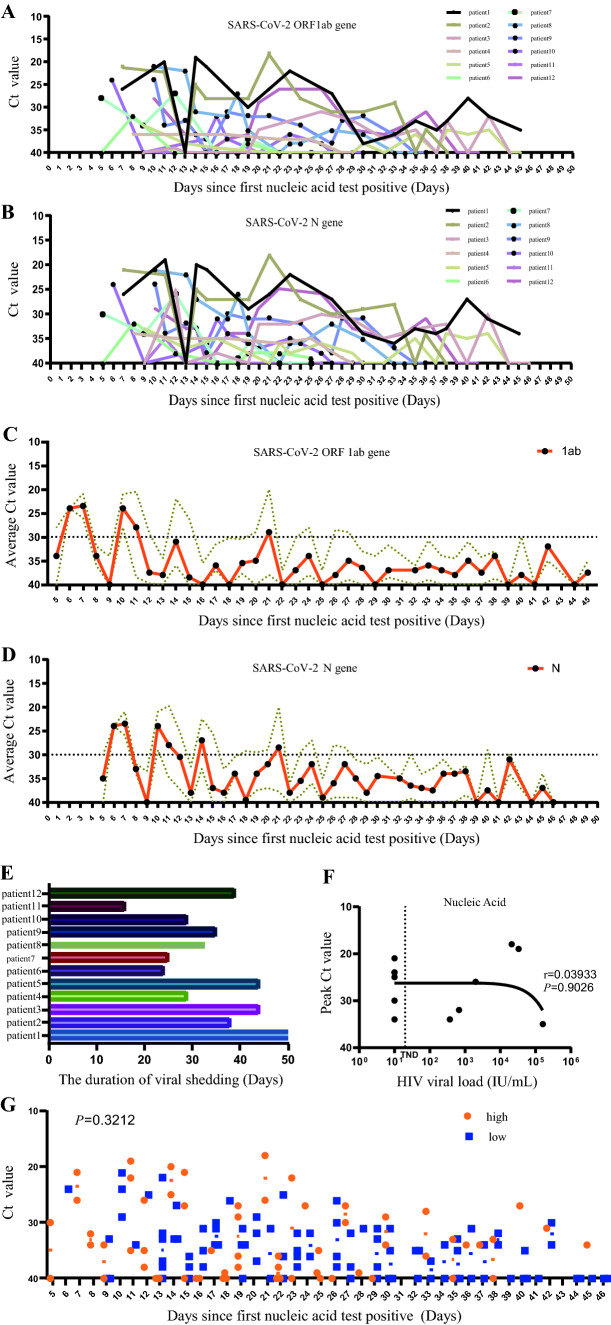
Fig. 2.
Changes in the Ct value targeting at SARS-CoV-2 ORF1ab (A) and N (B) gene of RT-qPCR in 12 patients with COVID-19/HIV co-infection. Ct = 37 is the cut-off for a positive result and Ct = 40 is a negative sample; Ct = 40 was the limit of detection. C represents Mean Ct value targeting at SARS-CoV-2 1ab gene from all patients at the different time interval between the first positive nucleic acid test, D represents Ct value targeting at SARS-CoV-2 N gene from all patients at the different time interval between the first positive nucleic acid test, Brown dotted lines represent error bar. E shows that the viral shedding time of COVID-19/HIV co-infection. F shows the correlation between Peak Ct value of SARS-CoV-2 N gene and HIV viral load, TND in X axis as an acronym for target not detected. G analyzes the difference of the SARS-CoV-2 Ct value between the two groups (< 200 and ≥ 200 copies/ml) of patients at different times since the first nucleic acid test positive

