
Fig. 3.
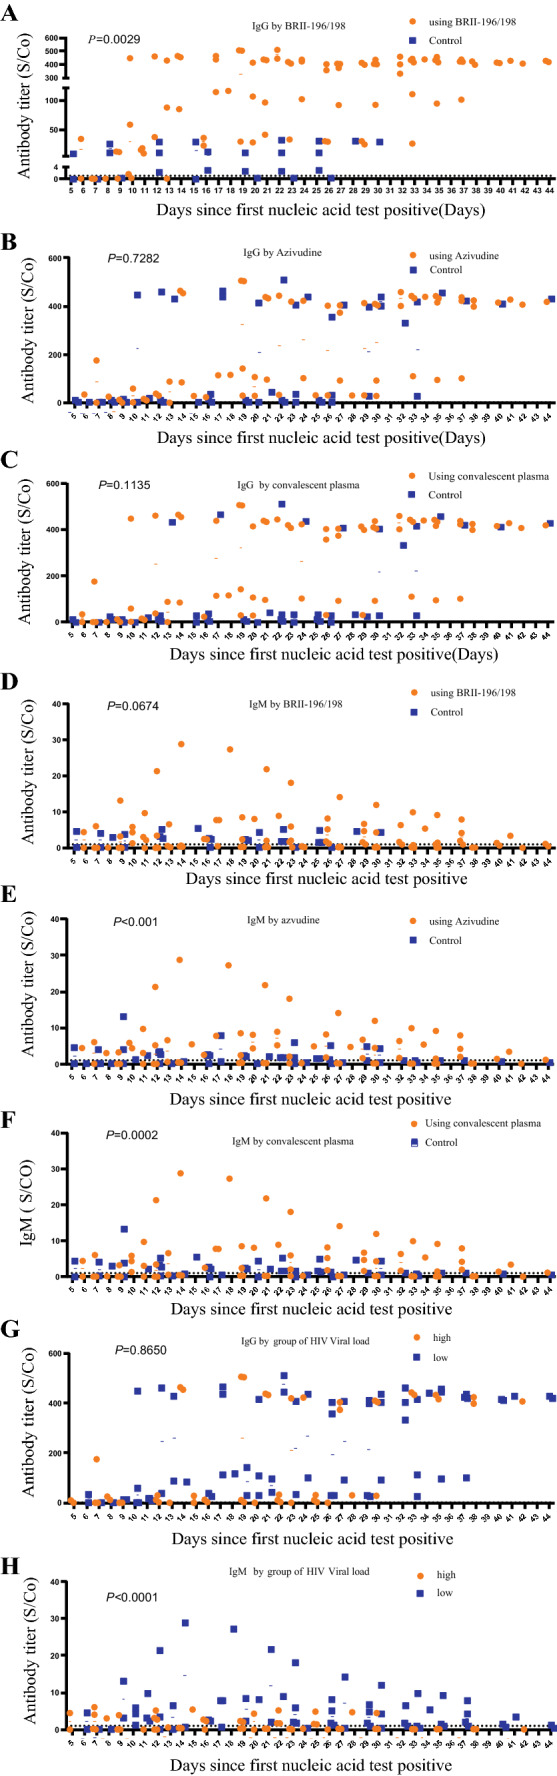
A–C represents the changes in IgG levels in combined medication of BRII/196 and BRII/198, Azvudine, Convalescent plasma, respectively. D–F represents the changes in IgM levels in combined medication of BRII/196 and BRII/198, Azvudine, Convalescent plasma, respectively. G shows the difference of IgG changes between two groups of HIV viral load, H represents difference of IgM changes between two groups of HIV viral load. X axis represents the interval time from the first positive nucleic acid test