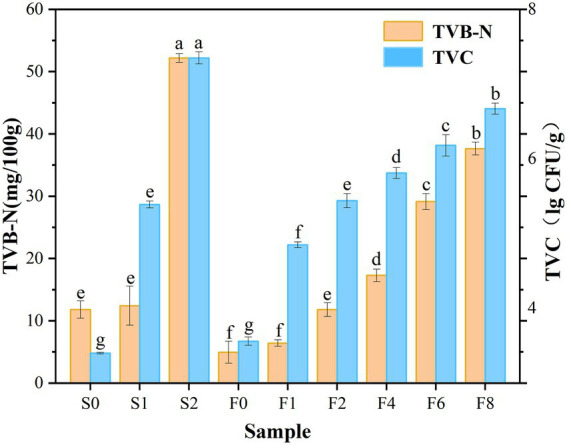
Figure 1.

Changes in TVB-N and TVC values. Notes: S0, S1, S2 denote the controls on day 0, 1, 2, respectively; F0, F1, F2, F4, F6, F8 denote zaoyu on day 0, 1, 2, 4, 6, 8, respectively; Z denotes the fermented rice. Different letters (a, b, c etc.) indicate significantly different means at p < 0.05 (analysis of variance; ANOVA). The same below.
