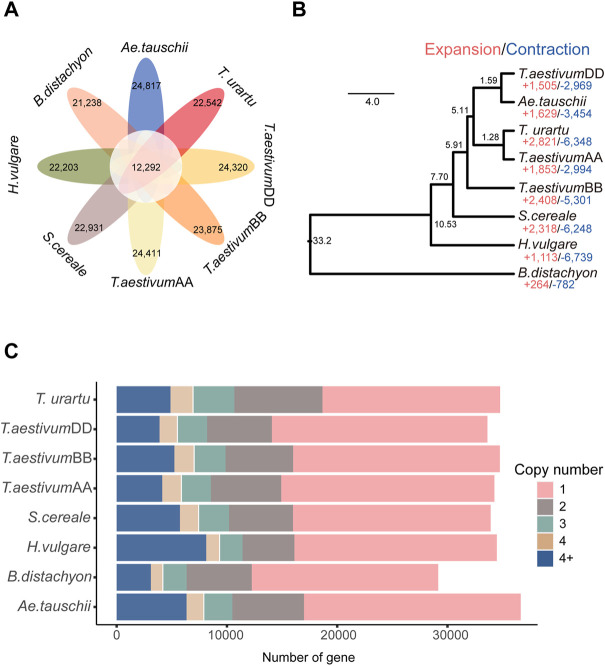
FIGURE 1.
Gene clustering and phylogenetic analysis. (A) Petal diagram of the OGs of 8 genomes/subgenomes; (B) CAFÉ-based estimates of gene family expansions and contractions. The numbers after “+” and “−” represent the number of expanded and contracted gene families, respectively; (C) Copy-number distribution of the OGs.

