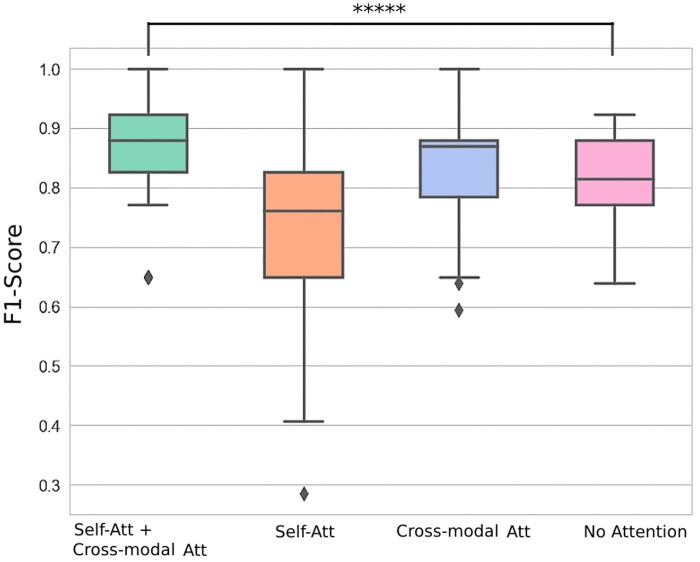
Figure 4.
F1-score distribution for different attention-based and attention-free baselines. Box plots showing the F1-score distribution across 100 random seeds to demonstrate the value of attention in a deep learning model. The F1-scores were calculated from a held-out test set. The horizontal line represents the median F1-score, and the boxes represent the first and third quartiles. The whiskers represent quartile 1 – (1.5 × interquartile range) and quartile 3 + (1.5 × interquartile range). The dots represent the individual F1-scores for each model. ****P .0001. The figure demonstrates that the combination of self-attention with cross-modal attention performs the best with the most narrow variation.

