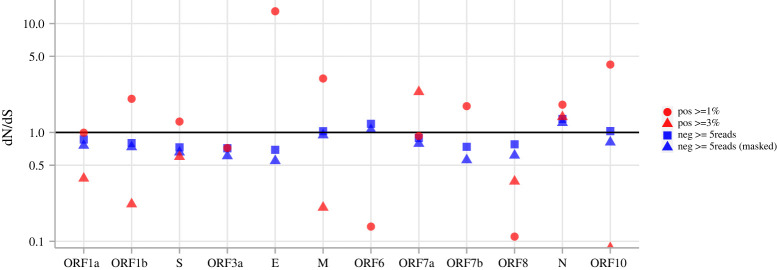
Figure 4.
dN/dS of SARS-CoV-2 coding regions computed with differently filtered variants. Red circles are from positive-strand variant sites with no less than 1% MAF; red triangles are from positive-strand variant sites with no less than 3% MAF. Blue squares are from negative-strand variant sites with at least five reads supporting the minor variant, blue triangles are the same sites but with A > T, C > A, T > A, T > G sites masked. ‘Pos > = 3%’ dN/dS = Inf are not shown for ORF3a, ORF6 and ORF7b. No ‘Pos > = 3%’ variant sites were called within E; therefore, dN/dS is not shown. (Online version in colour.)

