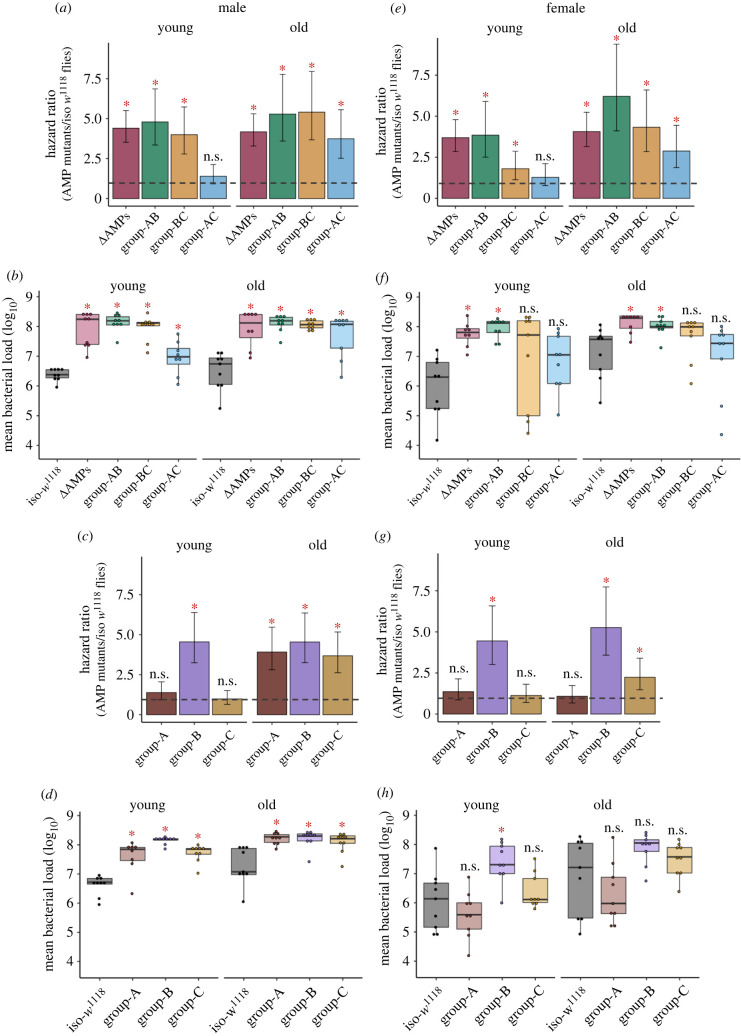
Figure 1.
Infection with Providencia rettgeri in multiple AMP-knockouts. The estimated hazard ratios, including their lower and upper limits of the 95% confidence interval, calculated from survival curves (160–180 flies/sex/infection treatment/age group/fly line; see electronic supplementary material, figure S2, S3), and bacterial load (n = 8–9 replicate groups/sex/treatment/age group/fly line) measured at 24 h after P. rettgeri infection across sexes and age groups. Hazard ratios for double combination of AMP-knockouts (i.e. group-AB, BC & AC; table 1 for details about the fly lines) in males (a) and females (e). Bacterial loads for double combination of AMP-knockouts in males (b) and females (f). Hazard ratios for single combination of AMP-knockouts (e.g. group-A, B & C) in males (c) and females (g). Bacterial load for single combination of compound of AMP-knockouts in males (d) and females (h). In panels (a,c,e,g), hazard ratios significantly greater than 1 (hazard ratio = 1; shown as horizontal dashed grey lines), indicated by asterisk (*), suggests higher infection susceptibility of mutant flies than the iso-w1118 control flies. In panels (b,d,f,h), each data point represents the bacterial load of flies pooled in a group of 6. Mutant fly lines that had significantly different bacterial load from wild-type iso-w1118 are indicated by asterisks. ns = not significant. Group A: flies lacking Defensin; Group B: flies lacking AMPs such as Drosocin, Diptericins and Attacins; Group C: flies lacking Metchnikowin and Drosomycin. Group A, B and C mutants were combined to generate flies lacking AMPs either from groups A and B (AB), or A and C (AC), or B and C (BC). (Online version in colour.)

