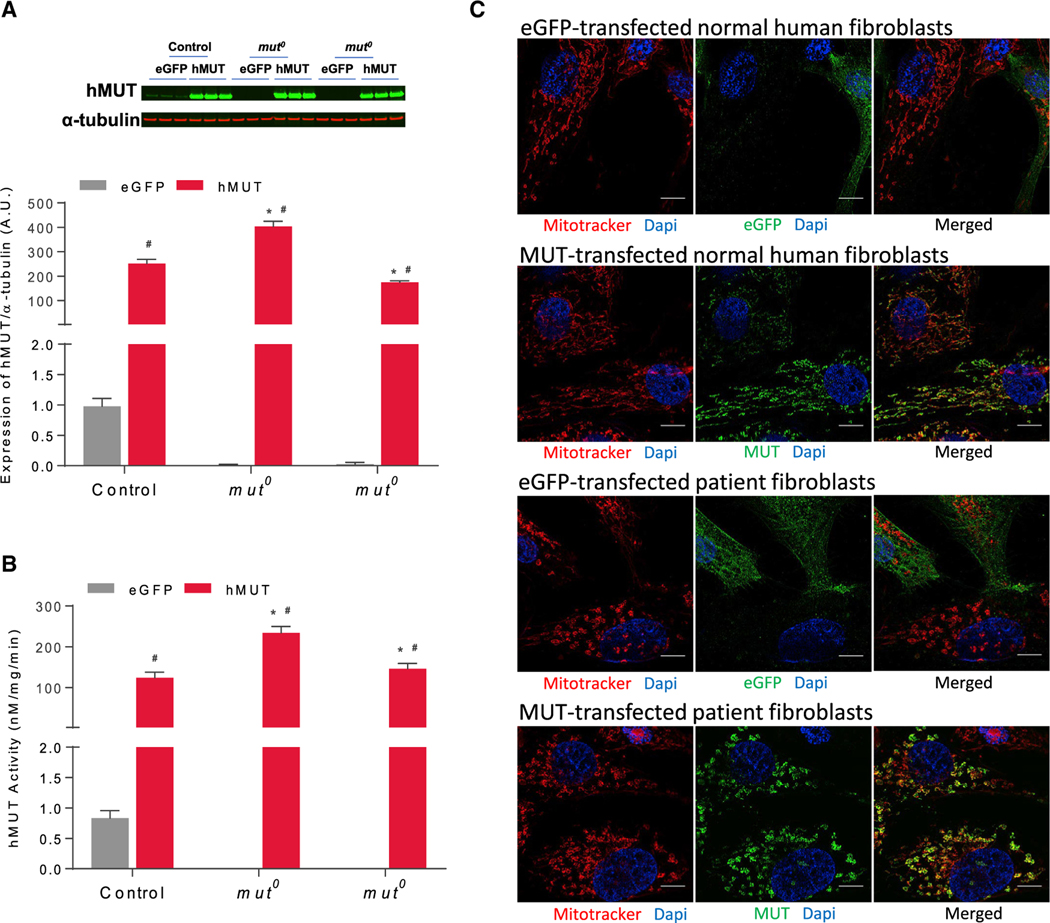
Figure 2. Expression, Activity, and Localization of mRNA-Encoded MUT.
Human fibroblasts (1 × 10⁶) isolated from a healthy subject (control) and 2 mut0 patients were transfected with 1 μg eGFP or hMUT mRNA for 24 hr.
(A) hMUT expression in transfected human fibroblasts was determined by western blotting. Expression levels were quantified and normalized to α-tubulin levels.
(B) MUT activity in transfected human fibroblasts.
(C) Transfected cells were incubated with MitoTracker Red for 30 min to mark mitochondria and then stained with an anti-MUT mouse monoclonal antibody (mAb) to examine cellular localization (scale bars, 10 μm).
Data are presented as mean ± SD. *p < 0.05 compared to corresponding control group of same treatment, #p < 0.05 compared to its own eGFP group. p values obtained from pairwise Tukey’s post hoc test after two-way ANOVA. n = 3 independent experiments.

