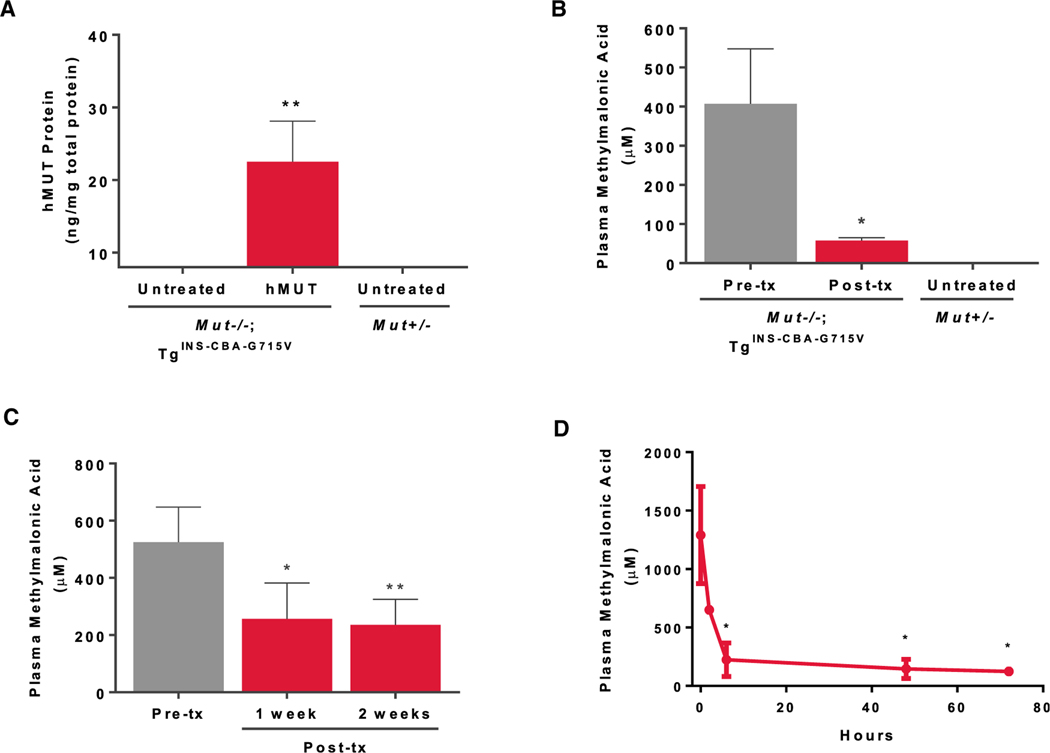
Figure 6. i.v. Administration of hMUT mRNA Improved Metabolism for More Than 1 Week in mut− MMA Mice.
(A) Mut−/−;TgINS-CBA-G715V (n = 4) were administered a single i.v. dose (0.2 mg/kg) of hMUT mRNA and sacrificed 3 days later. Hepatic hMUT expression measured by LC-MS/MS in Mut−/−;TgINS-CBA-G715V mice 3 days after a single i.v. hMUT mRNA injection.
(B) Plasma methylmalonic acid concentrations in Mut−/−;TgINS-MCK-Mut mice 1 day before and 3 days after a single i.v. hMUT mRNA injection.
(C) Plasma methylmalonic acid concentrations 1 day before, 1 week after, and 2 weeks after a single i.v. injection of hMUT mRNA (0.1 mg/kg) in Mut−/−;TgINS-CBA-G715V mice (n = 4).
(D) Plasma methylmalonic acid concentrations 1 day before, 2, 6, 48, and 72 hr after a single i.v. injection of hMUT mRNA (0.2 mg/kg) in Mut−/−;TgINS-CBA-G715V mice (n = 7).
(A–D) Data shown as mean ± SD (A–C) and median ± MAD (D). *p < 0.05, **p < 0.01. values obtained from paired t tests to compare post-treatment versus pre-treatment values.

