. 2022 Nov 16;12(51):32925–32948. doi: 10.1039/d2ra05535j

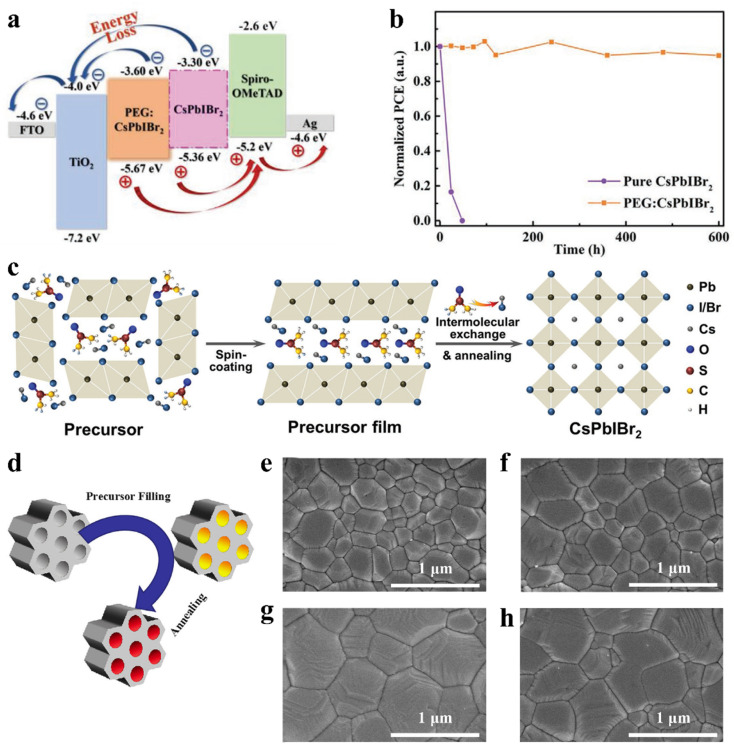
Fig. 12. (a). Corresponding energy band diagrams of the cell. (b). Time-dependent (RH of 35% and temperature of 25 °C) of normalized PCE for the devices with and without PEG. (a and b) Reproduced with permission.138 Copyright 2020, Wiley-VCH. (c). Illustration of intermolecular exchange strategy. Reproduced with permission.141 Copyright 2018, Wiley-VCH. (d). Schematic diagram of the nanoconfined crystallization of CsPbIBr2 in ZrSBA-15. Top-view SEM images of various CsPbIBr2 perovskite films: (e). without ZrSBA-15; (f). with 0.01 wt% ZrSBA-15; g. with 0.1 wt% ZrSBA-15; and (h). with 1 wt% ZrSBA-15. (d–h) Reproduced with permission.145 Copyright 2021, Wiley-VCH.

Fig. 12