. 2022 Nov 16;12(51):32925–32948. doi: 10.1039/d2ra05535j

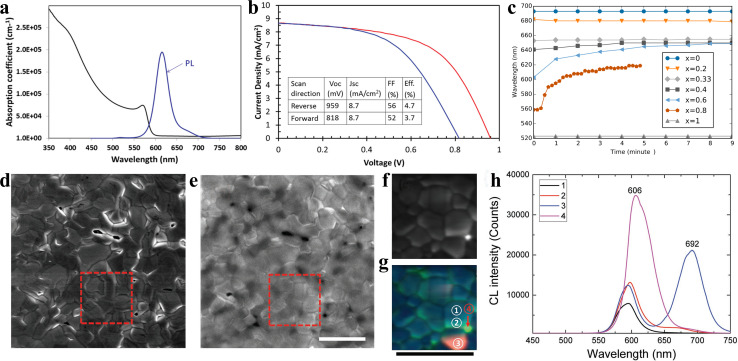
Fig. 8. (a). Absorption coefficient and steady-state PL spectrum of CsPbIBr2 sample. (b). JV curves of the best-performing CsPbIBr2 cell. (a and b) Reproduced with permission.33 Copyright 2016, Wiley-VCH. (c). PL peak position as a function of time for CsPb(BrxI1−x)3 materials under ∼l sun illumination. Reprinted with permission.44 Copyright 2016, the American Chemical Society. (d) Secondary electron SEM image and (e) CL PMT mapping of the CsPbIBr2 film (1024 × 1024 pixels (≈11 nm on a side); dwell time 50 μs per pixel) with the electron beam acceleration voltage of 5 kV and current of 799 pA. The square region in d was further studied by CL spectrum mapping with different spectral windows of 530–630 nm (pixel size of 40 nm × 40 nm; dwell time of 10 ms). (g). Superposition of (f). (h). CL spectra for the area inside a CsPbIBr2 grain (GI; region ① in (g)), grain boundary (GB; region ② in (g)), and I-rich phase (areas ③ and ④ in (g)). All the scale bars are 3 μm. (d–h) Reproduced with permission.99 Copyright 2017, Wiley-VCH.

Fig. 8