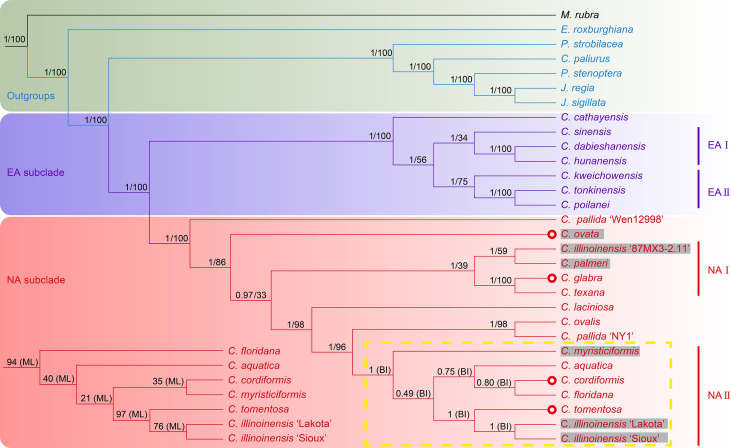
Figure 4.
Phylogenetic trees of Carya species and representative species in other genera of Juglandaceae inferred from the datasets of complete plastomes using Bayesian inference and maximum likelihood method. The posterior probability (PP) and bootstrap (BS) values that supported each node are shown above the branches. The colors in green, light purple and pink indicate the outgroups, EA and NA Carya species, respectively. The letter n represents the haplotype, and x represent and the number before it shows the chromosomal set of the haplotype of each species. The numbers after n and x are the chromosomes of haplotype of each species. Red circles show the species in section Apocarya, gray background and the red circles indicate the tropical distributed species/varieties. The lower left quarter and the yellow box respectively show the parts with different topologies in the trees based on ML and BI methods.

