Figure 9.

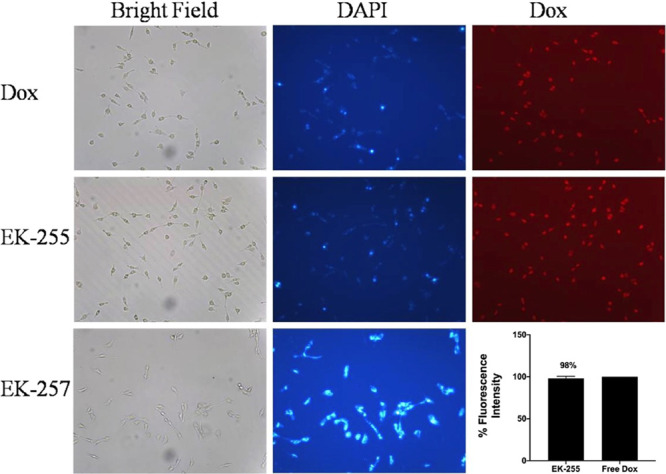
Cellular uptake analysis by fluorescence microscopy. Microscopic images were taken at 40× magnification. Histogram shows the quantitative analysis of cellular uptake.

Cellular uptake analysis by fluorescence microscopy. Microscopic images were taken at 40× magnification. Histogram shows the quantitative analysis of cellular uptake.