Figure 4.

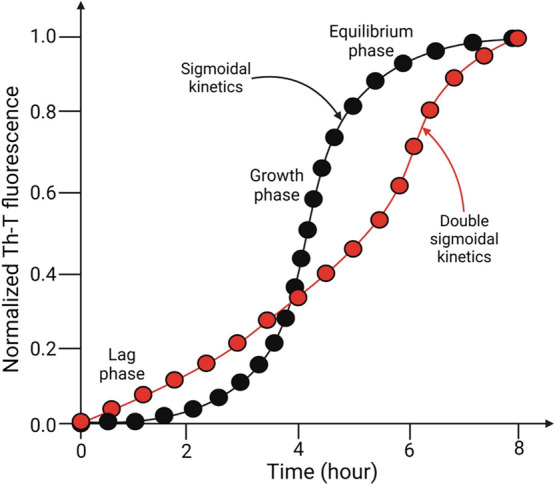
Sigmoidal (black) and double-sigmoidal (red) kinetics of insulin fibrillation passing through the lag, growth, and equilibrium phases—as determined by Th-T fluorescence.

Sigmoidal (black) and double-sigmoidal (red) kinetics of insulin fibrillation passing through the lag, growth, and equilibrium phases—as determined by Th-T fluorescence.