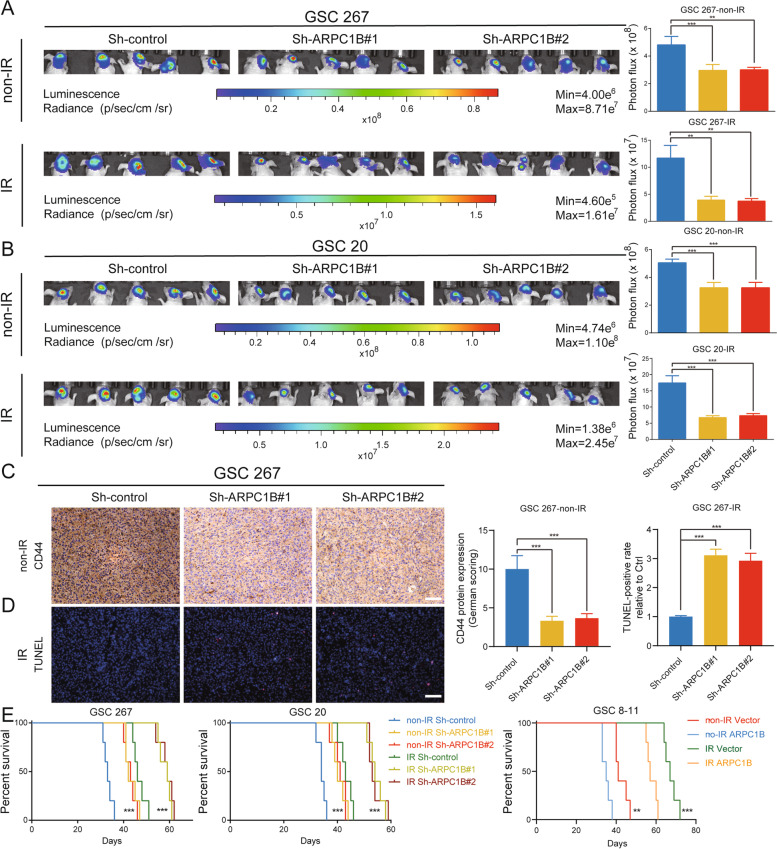
Fig. 3.
ARPC1B promotes GSC progression and IR resistance in vivo. A, B Bioluminescence imaging of tumor size on day 30 in sh-control, sh-ARPC1B#1 and sh-ARPC1B#2 GSC 267 (A) or GSC 20 (B) xenograft nude mice receiving or not receiving IR treatment. The right panel shows the quantification of photon counts of GSC 267 and GSC 20 xenografts. C Representative images and quantification of IHC staining for CD44 in sections of non-IR GSC 267 xenografts. Scale bar, 200 μm. D Representative images and quantification of TUNEL staining in sections of IR-treated GSC 267 xenografts. Scale bar, 200 μm. E Kaplan–Meier curves visualizing the survival of GSC 267, GSC 20 and GSC 8-11 xenograft mice in different groups

