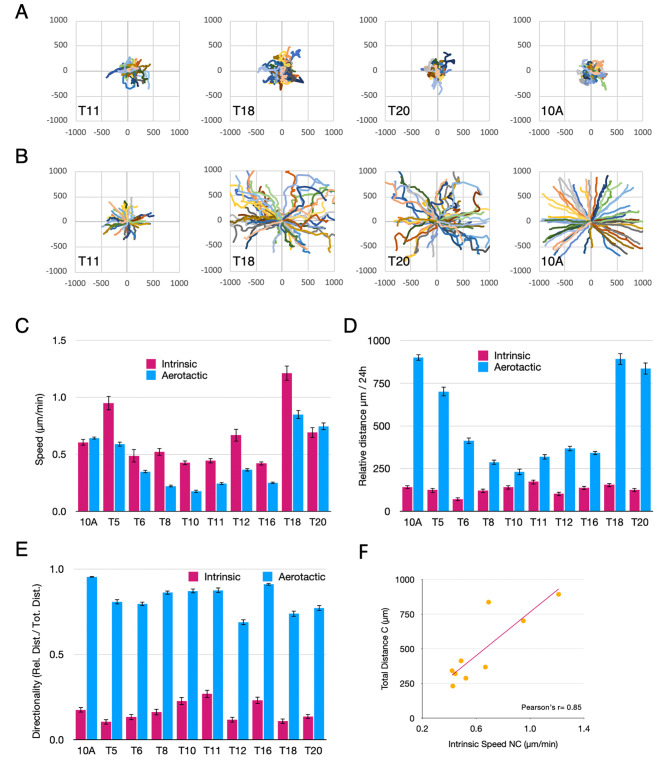
Fig. 2.
Comparison of aerotaxis versus intrinsic migration of breast cancer cells. 24 h trajectories of 50 representative cells per condition followed as XY plots (scales in µm) of the indicated cells either (A) plated at 5% confluency (intrinsic migration) or (B) subjected to the aerotactic assay (see also Figure S2 for T5, T6, T8 T10 and T16 cells). (C) Mean values of speed ± SD (in µm/min) of the indicated cells (10 A stands for MCF10A). (D) Mean relative distance of migration ± SD (in µm) of the indicated cells at 24 h. (E) Mean directionality ± SD (no unit) is given for aerotaxis (blue) and intrinsic (carmine) cell migration. (F) Graphical representation of the intrinsic speed of tumour cells as a function of the relative distance travelled in the aerotactic test. Pearson’s correlation coefficient is given. (All of the data displayed are representative of at least 3 independent experiments)

