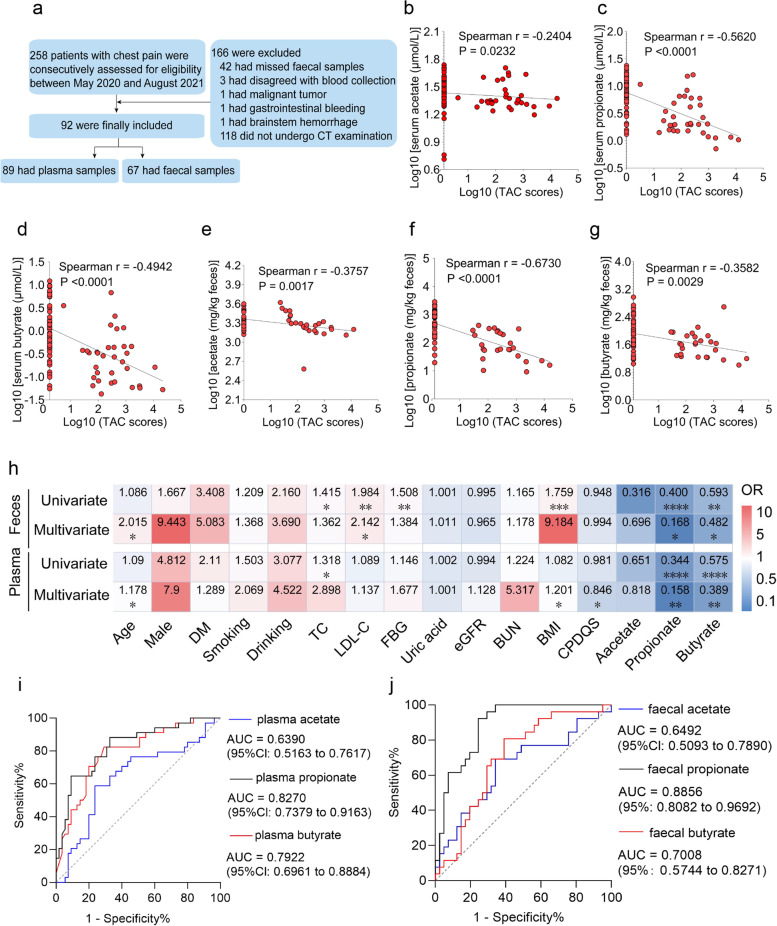
Fig. 1.
Correlation analysis of the levels of SCFAs (acetate, propionate and butyrate) with calcification scores. a A flow diagram of the enrolled research subjects. b–d Spearman’s correlation analyses of acetate, propionate and butyrate levels in plasma with calcification scores, respectively. e–g Spearman’s correlation analyses of acetate, propionate and butyrate levels in faeces with calcification scores, respectively. h Univariate and multivariate regression models were applied to analyse the correlations of acetate, propionate and butyrate levels in plasma and faeces with calcification scores. Blue: odds ratio (OR) <1.00 and negative correlation; Red: OR > 1.00 and positive correlation; *P < 0.05, **P < 0.01, ***P < 0.001, ****P < 0.0001. i, j Predictive ability of acetate, propionate and butyrate levels in plasma and faeces for vascular calcification, respectively

