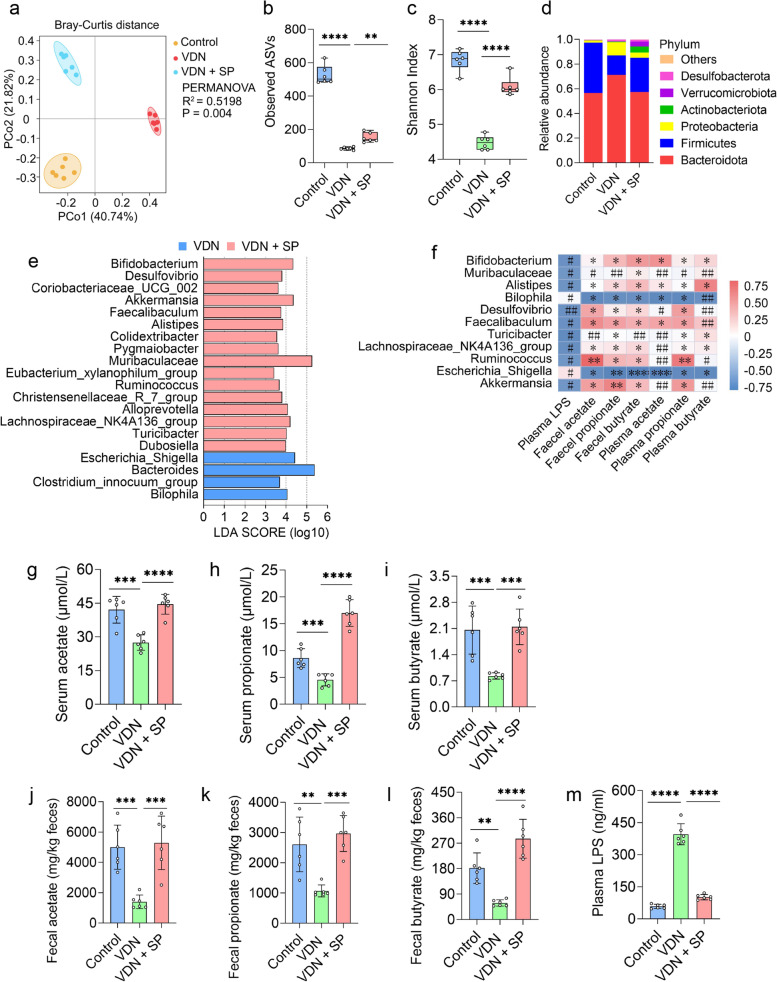
Fig. 3.
Amelioration of intestinal microbiota imbalance in rats by oral propionate administration. a Principal coordinate analysis (PCoA) diagram showing the β-diversity of intestinal microbiota among the three groups. b, c α-diversity of the intestinal microbiota. d Relative abundance of intestinal microbiota constituents at the phylum level. e Analysis of the differences in the intestinal microbiota by LEfSe. f Spearman’s correlation analysis of the relationship of the intestinal microbiota with LPS and SCFAs. Negative and positive correlations are denoted in blue and red, respectively. g–i Acetate, propionate and butyrate levels in plasma, respectively. j–l Acetate, propionate and butyrate concentrations in faeces, respectively. m Plasma LPS levels. Data are presented as the mean ± standard deviation (SD). Statistical significance was determined using one-way ANOVA or the Kruskal–Wallis test (Tukey post hoc test). NS for P > 0.05, #P < 0.25, ##P < 0.1, *P< 0.05, **P< 0.01, ***P< 0.001, ****P< 0.0001

