
Figure 1.
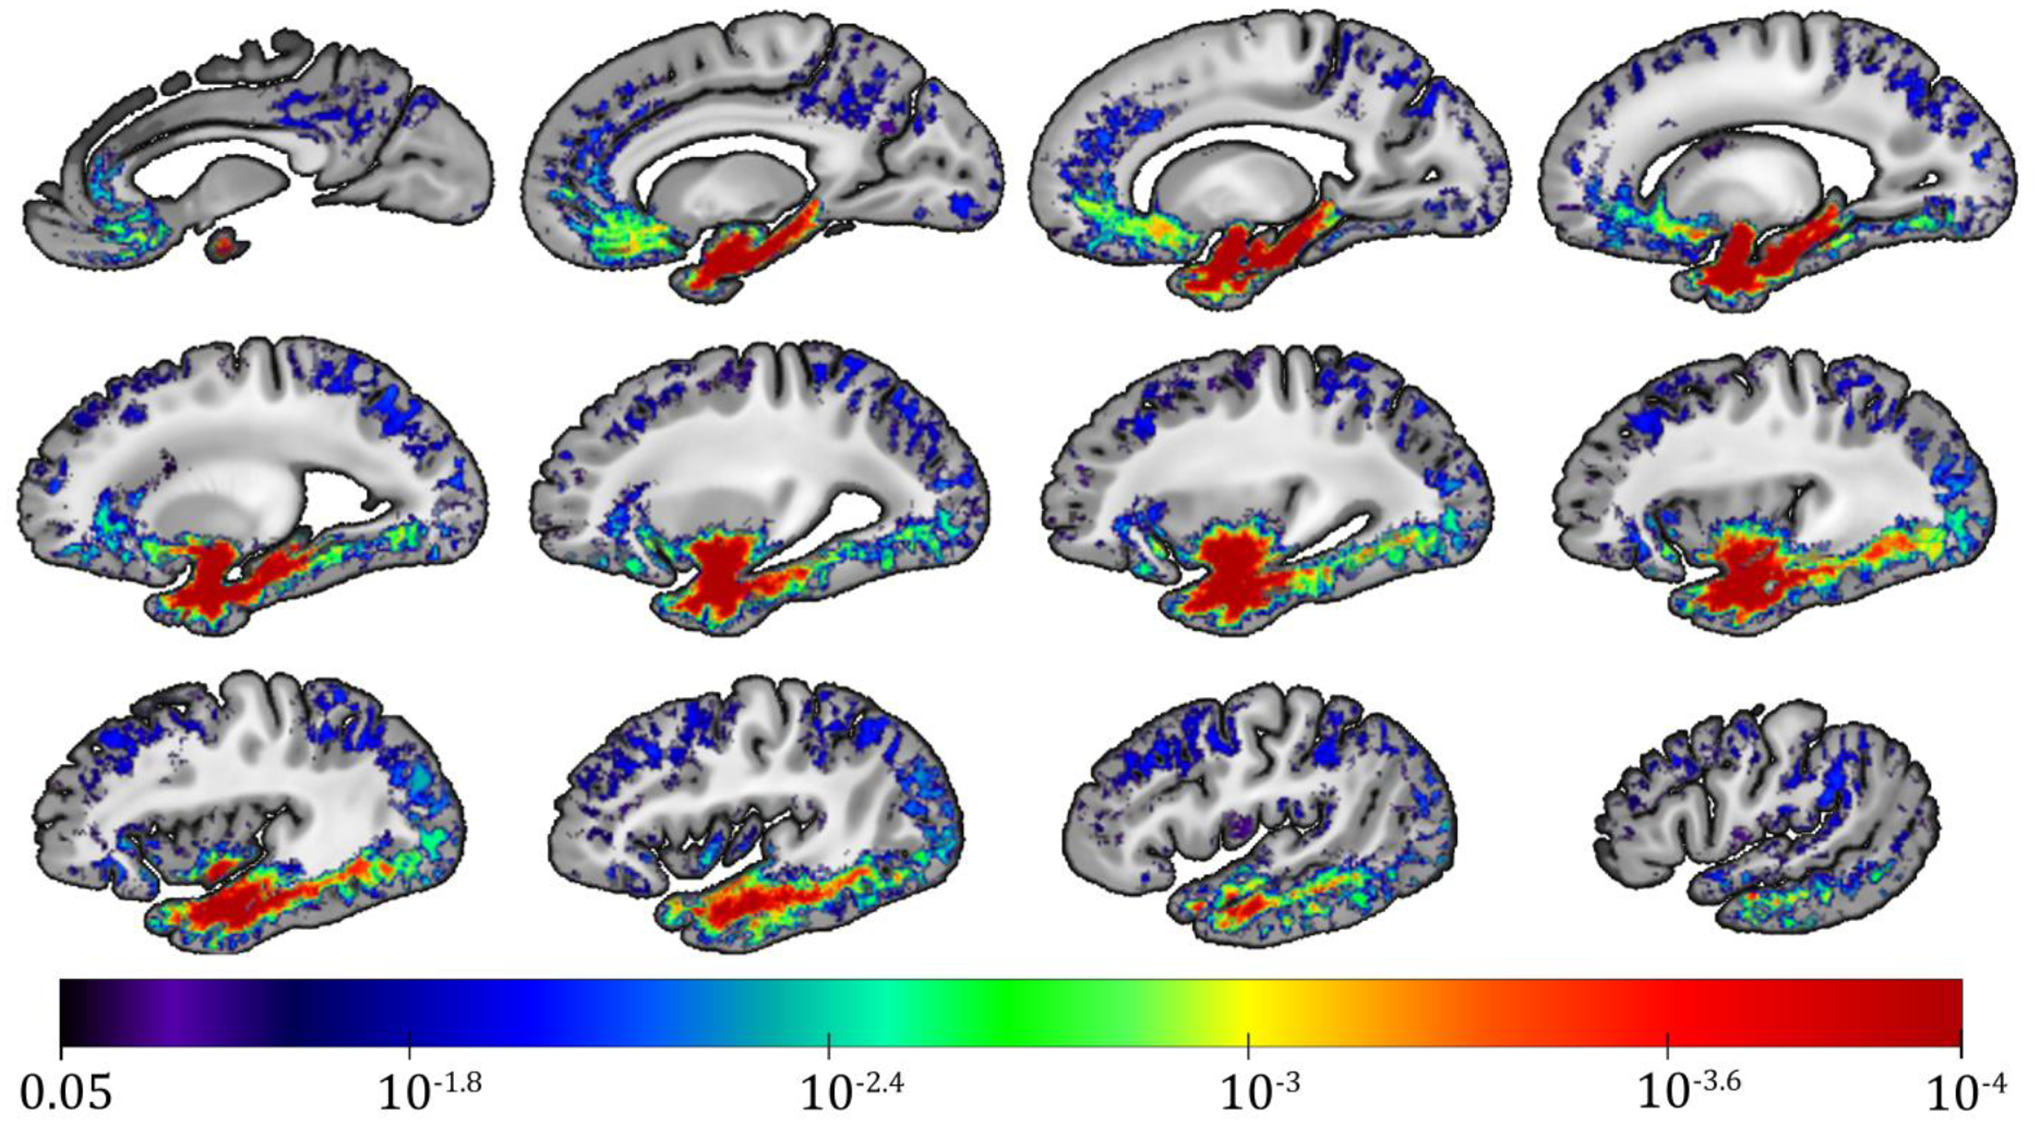
Sagittal images arranged from medial (top left) to lateral (bottom right) showing regions in which the R2 relaxation rate is significantly lower for higher LATE-NC stage according to voxel-wise linear regression that controlled for other neuropathologies, demographics and covariates. The color-scale represents the FWER-corrected p-values obtained from the voxel-wise linear regression, and the gray-scale images are showing the ex-vivo MRI brain hemisphere template used in this work.