
Figure 2.
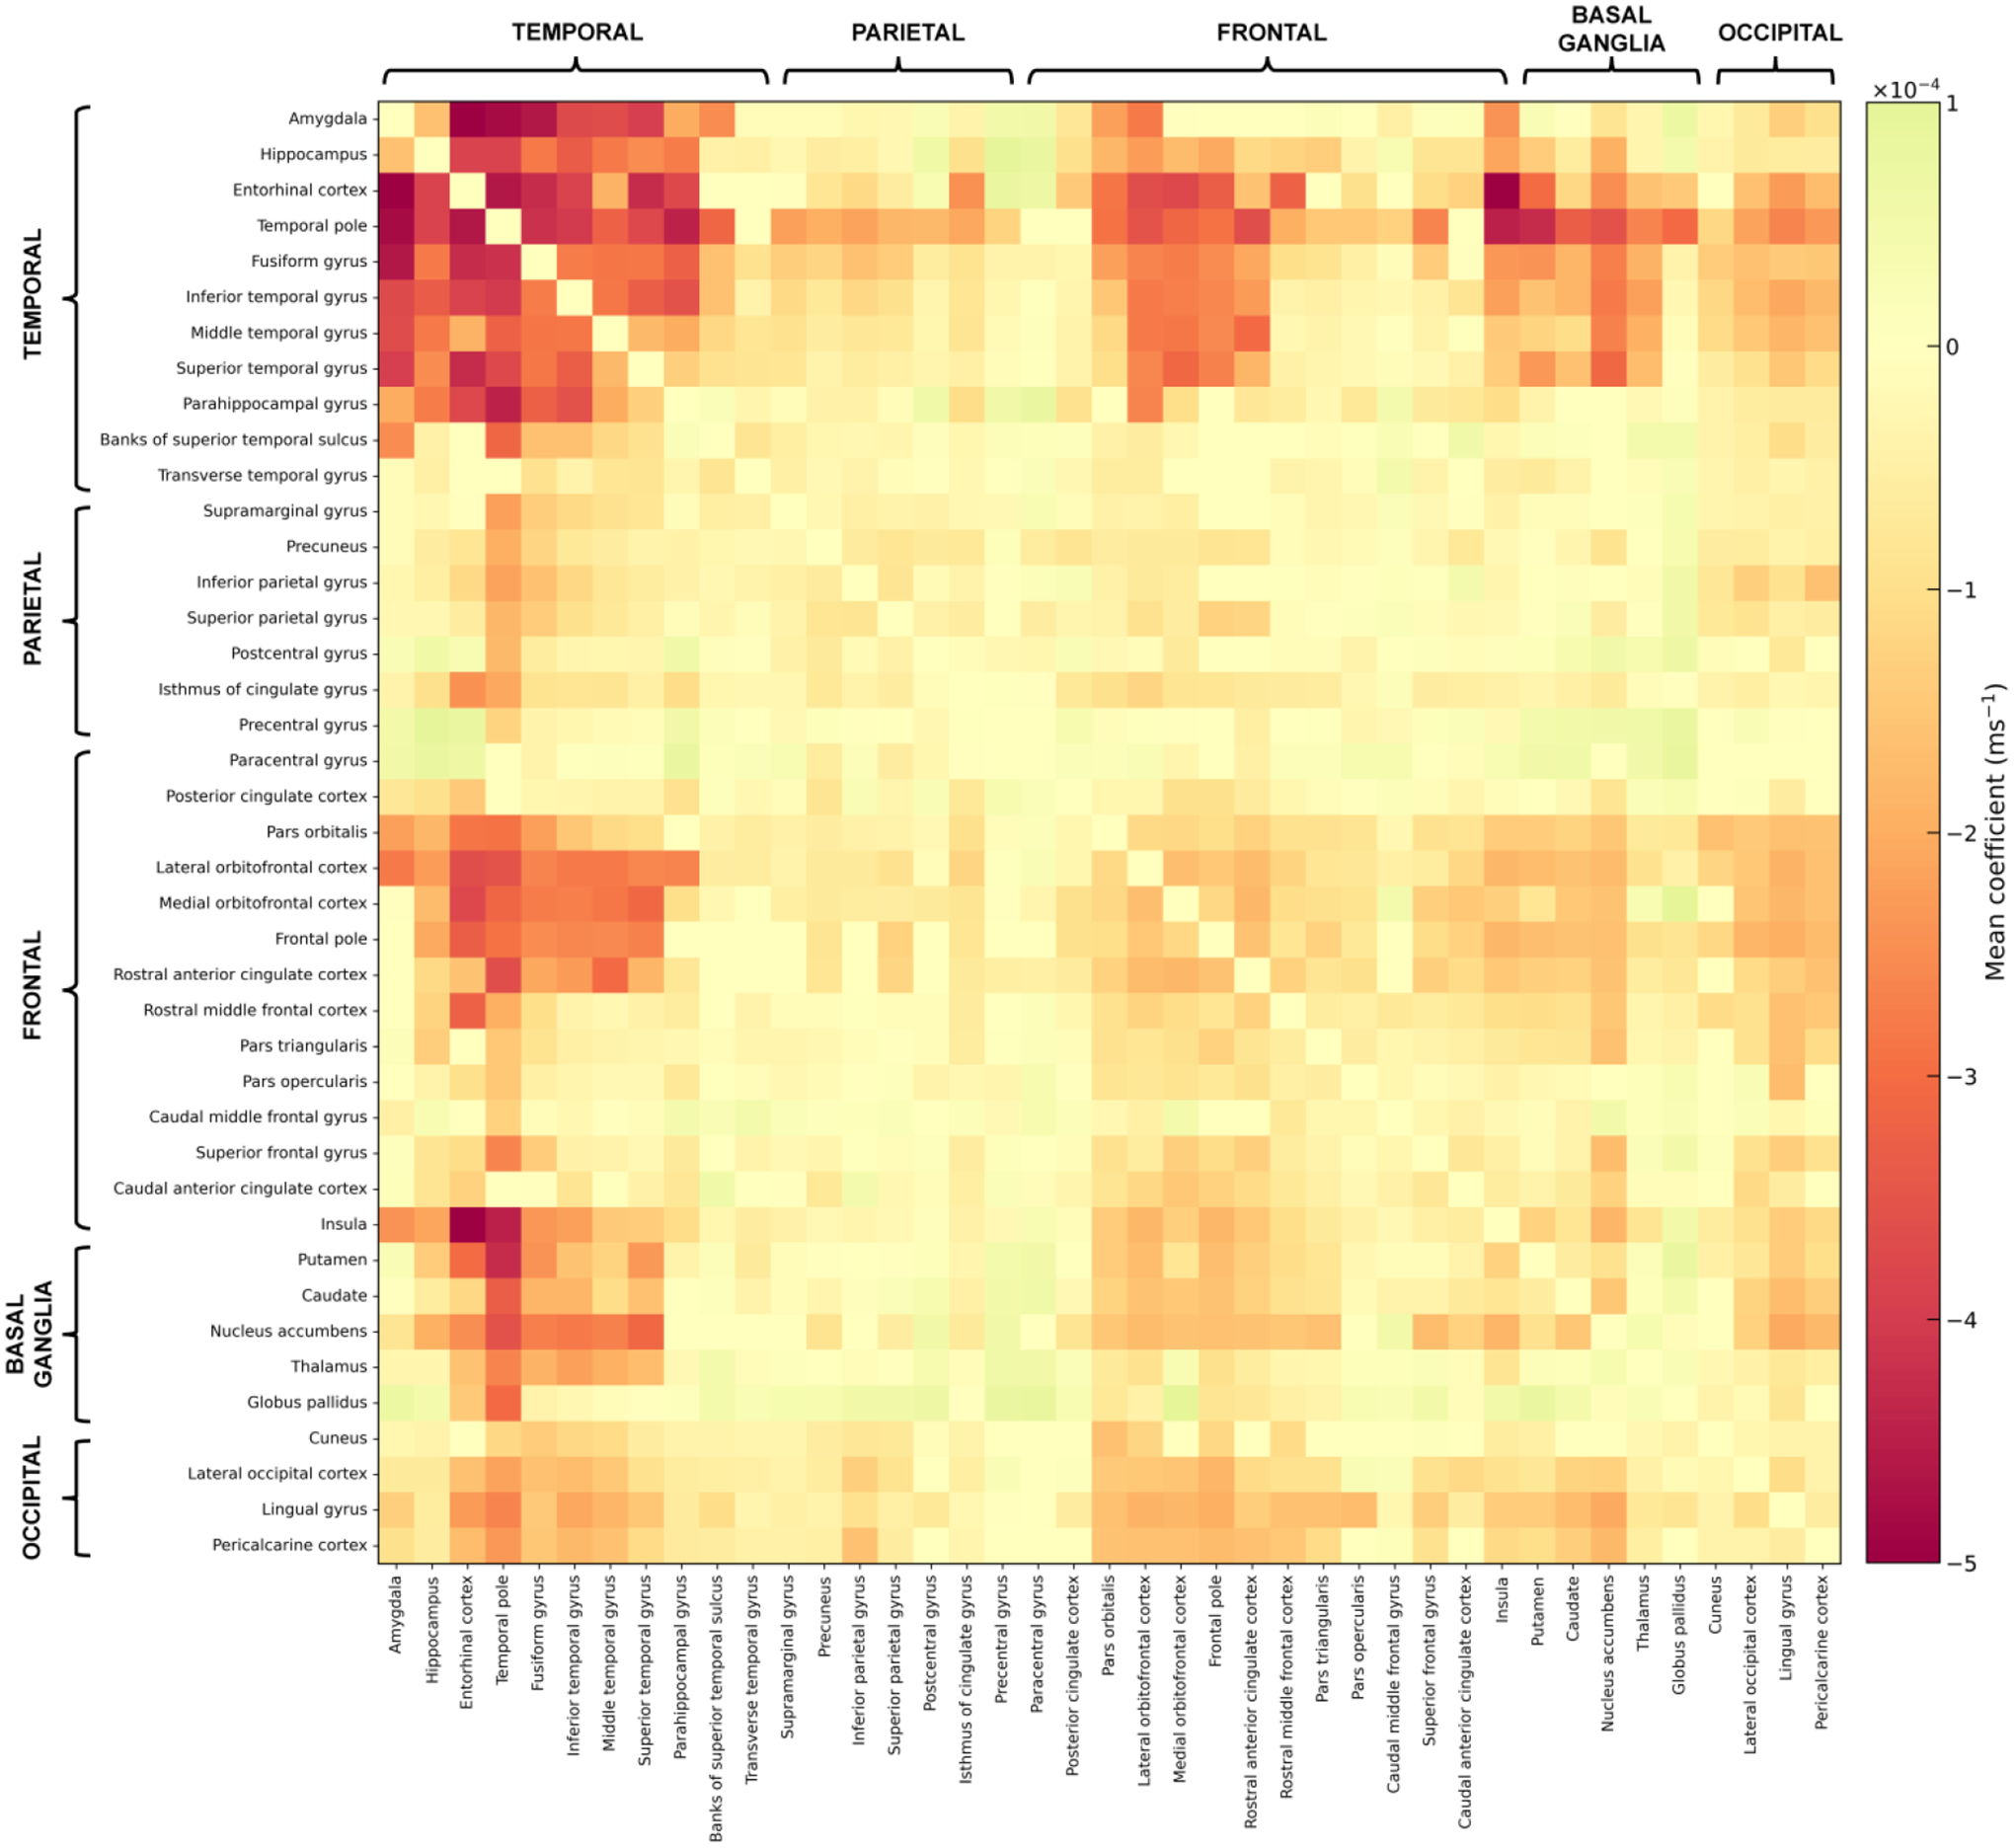
Connectivity matrix showing the mean coefficient derived from the voxel-wise analysis on the association of R2 with LATE-NC per connection of the structural connectome. Dark red colors represent the most negative associations of R2 values with LATE-NC.