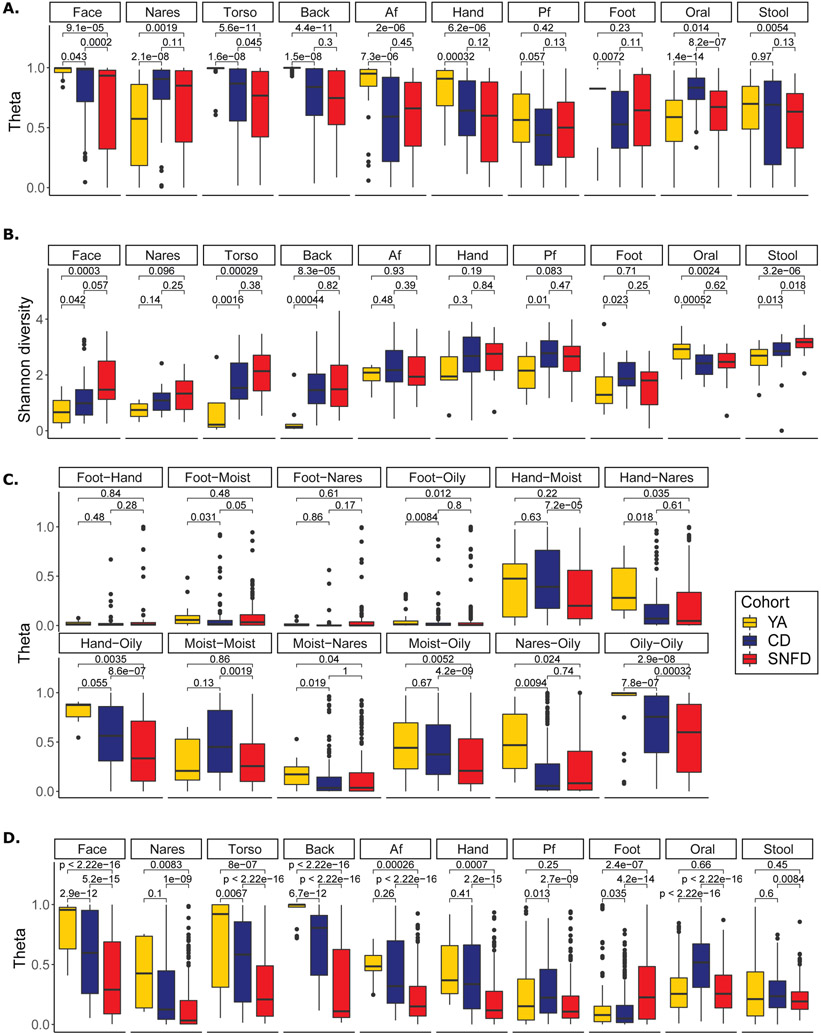
Fig. 2. Instability, Hyperdiversification, Heterogeneity, and Biogeographic Divergence in the Aging Microbiome.
(A) Stability, as measured by Yue-Clayton theta index (θ) comparing samples from an individual at different timepoints. θ=1 represents 100% similarity in shared species and their relative abundance; θ=0 indicates no (0%) similarity. The expanded YA cohort – including the in-house, MET and HMP samples -- was used to estimate stability. YA samples from Oh et al. 2016 (face, torso, back, Af, Hand, Pf, foot) had three timepoints, 10-30 months between timepoint 1 and 2, and 5-10 weeks between timepoints 2 and 3. YA samples from Zhou et al. 2021 had 2-4 time points, 2-4 weeks apart. 58 unpublished in-house YA stool samples had 2 time points, approximately 1 year apart (Table S2). HMP samples (YA nares, oral, stool) were taken at ~2 week intervals, as our SNFD and CD cohorts. Additional YA samples were cross-sectional. The analyses were conducted using n=406 YA skin, n=421 YA gut, n=275 YA oral, n=498 CD skin, n=64 CD gut, n= 62 CD oral, n=522 SNFD skin, n=53 SNFD gut, n= 66 SNFD oral time series samples. (B) Shannon Diversity Index represents the number and evenness of different taxa. Diversity of YA was estimated using only the in-house YA cohort. (C) Biogeographic divergence, as measured by θ comparing samples from different skin sites on the same individual at the same timepoint. Divergence of YA was estimated using only the in-house YA cohort. Hand sampling in this study included both dry and moist sites, so we treated hand samples as a distinct site type, as are feet. (D) Inter-individual similarity, as measured by θ comparing samples between individuals within each cohort. Similarity of YA was estimated using only the in-house YA cohort. Lower θ within a cohort ~ higher heterogeneity. The analyses for B, C, and D were conducted using n=83 YA skin, n=53 YA gut, n=28 YA oral, n=195 CD skin, n=25 CD gut, n=25 CD oral, n=176 SNFD skin, n=20 SNFD gut, and n=22 SNFD oral biologically independent (i.e. averaged across repeated measurements) samples. Boxplot edges represent the lower and upper quartile, center lines represent the median, whiskers are extended to the most extreme data point that is no more than 1.5 times the interquartile range from the edges. Benjamini-Hochberg-adjusted two-sided Wilcoxon tests p values are indicated for each comparison. Analogous Bray-Curtis dissimiliarities, analyses using the expanded YA cohort, and analyses using data rarefied to 500,000 and 100,000 reads are reported in fig. S5-S7.

