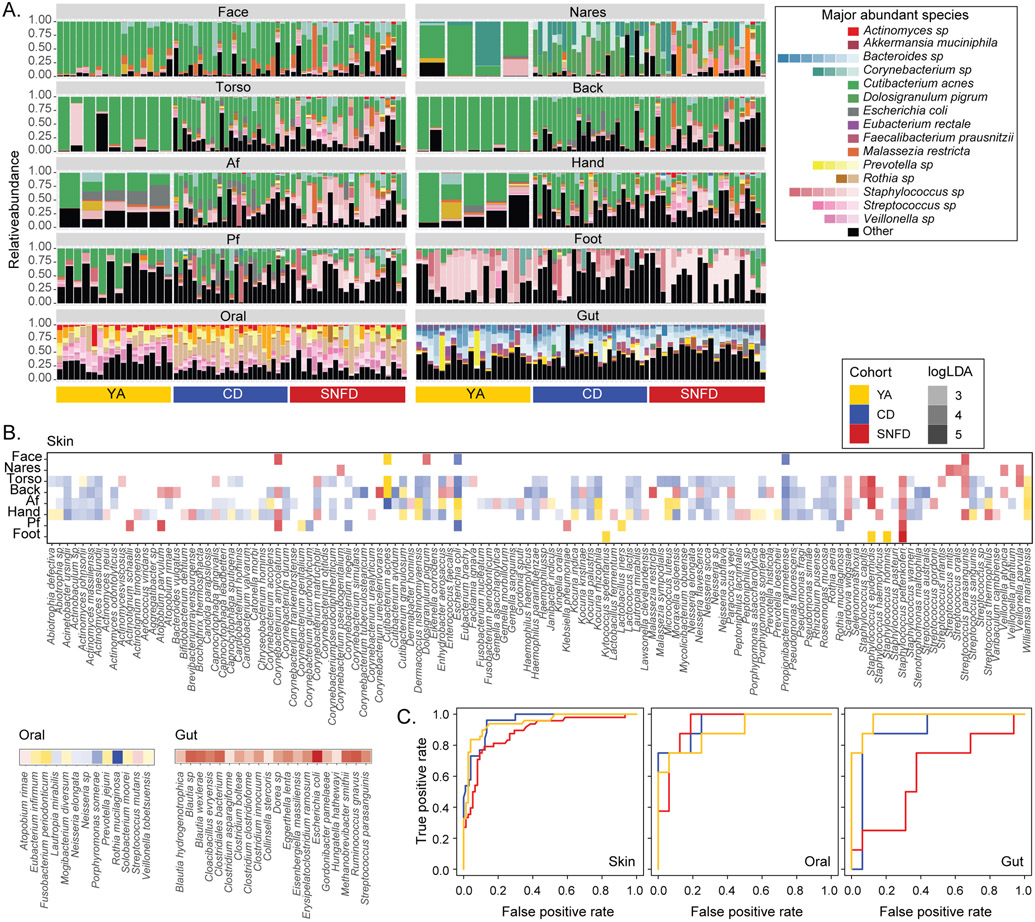
Fig. 3. Compositional Differences in the Microbiota of Older Adults.
Only the in-house YA cohort was used. (A) Relative abundance plots of microbial species across body sites. The top 10 most abundant species in the skin, oral, and gut samples for YA, CD, SNFD cohorts were shown. Each bar represents an individual with relative abundance values from all timepoints averaged. See table S3 for full classifications and fig. S8A for full legend. ~20 YA subjects were shown for each body site. (B) Microbial species significantly enriched in YA, CD, or SNFD cohort. Only significant and strongly enriched species (Kruskal-Wallis test p < 0.05 and log10LDA > 2.0) are shown. Color opacity indicates the corresponding log10LDA value. (C) Receiver operating characteristic (ROC) curves for random forests classifiers assigning individuals into YA (orange), CD (blue), or SNFD (red) based on species-level taxonomic composition. Repeated measurements were averaged for each subject-body site combination. Analogous analyses using the expanded YA cohort are reported in fig. S8 and fig. S9A.

