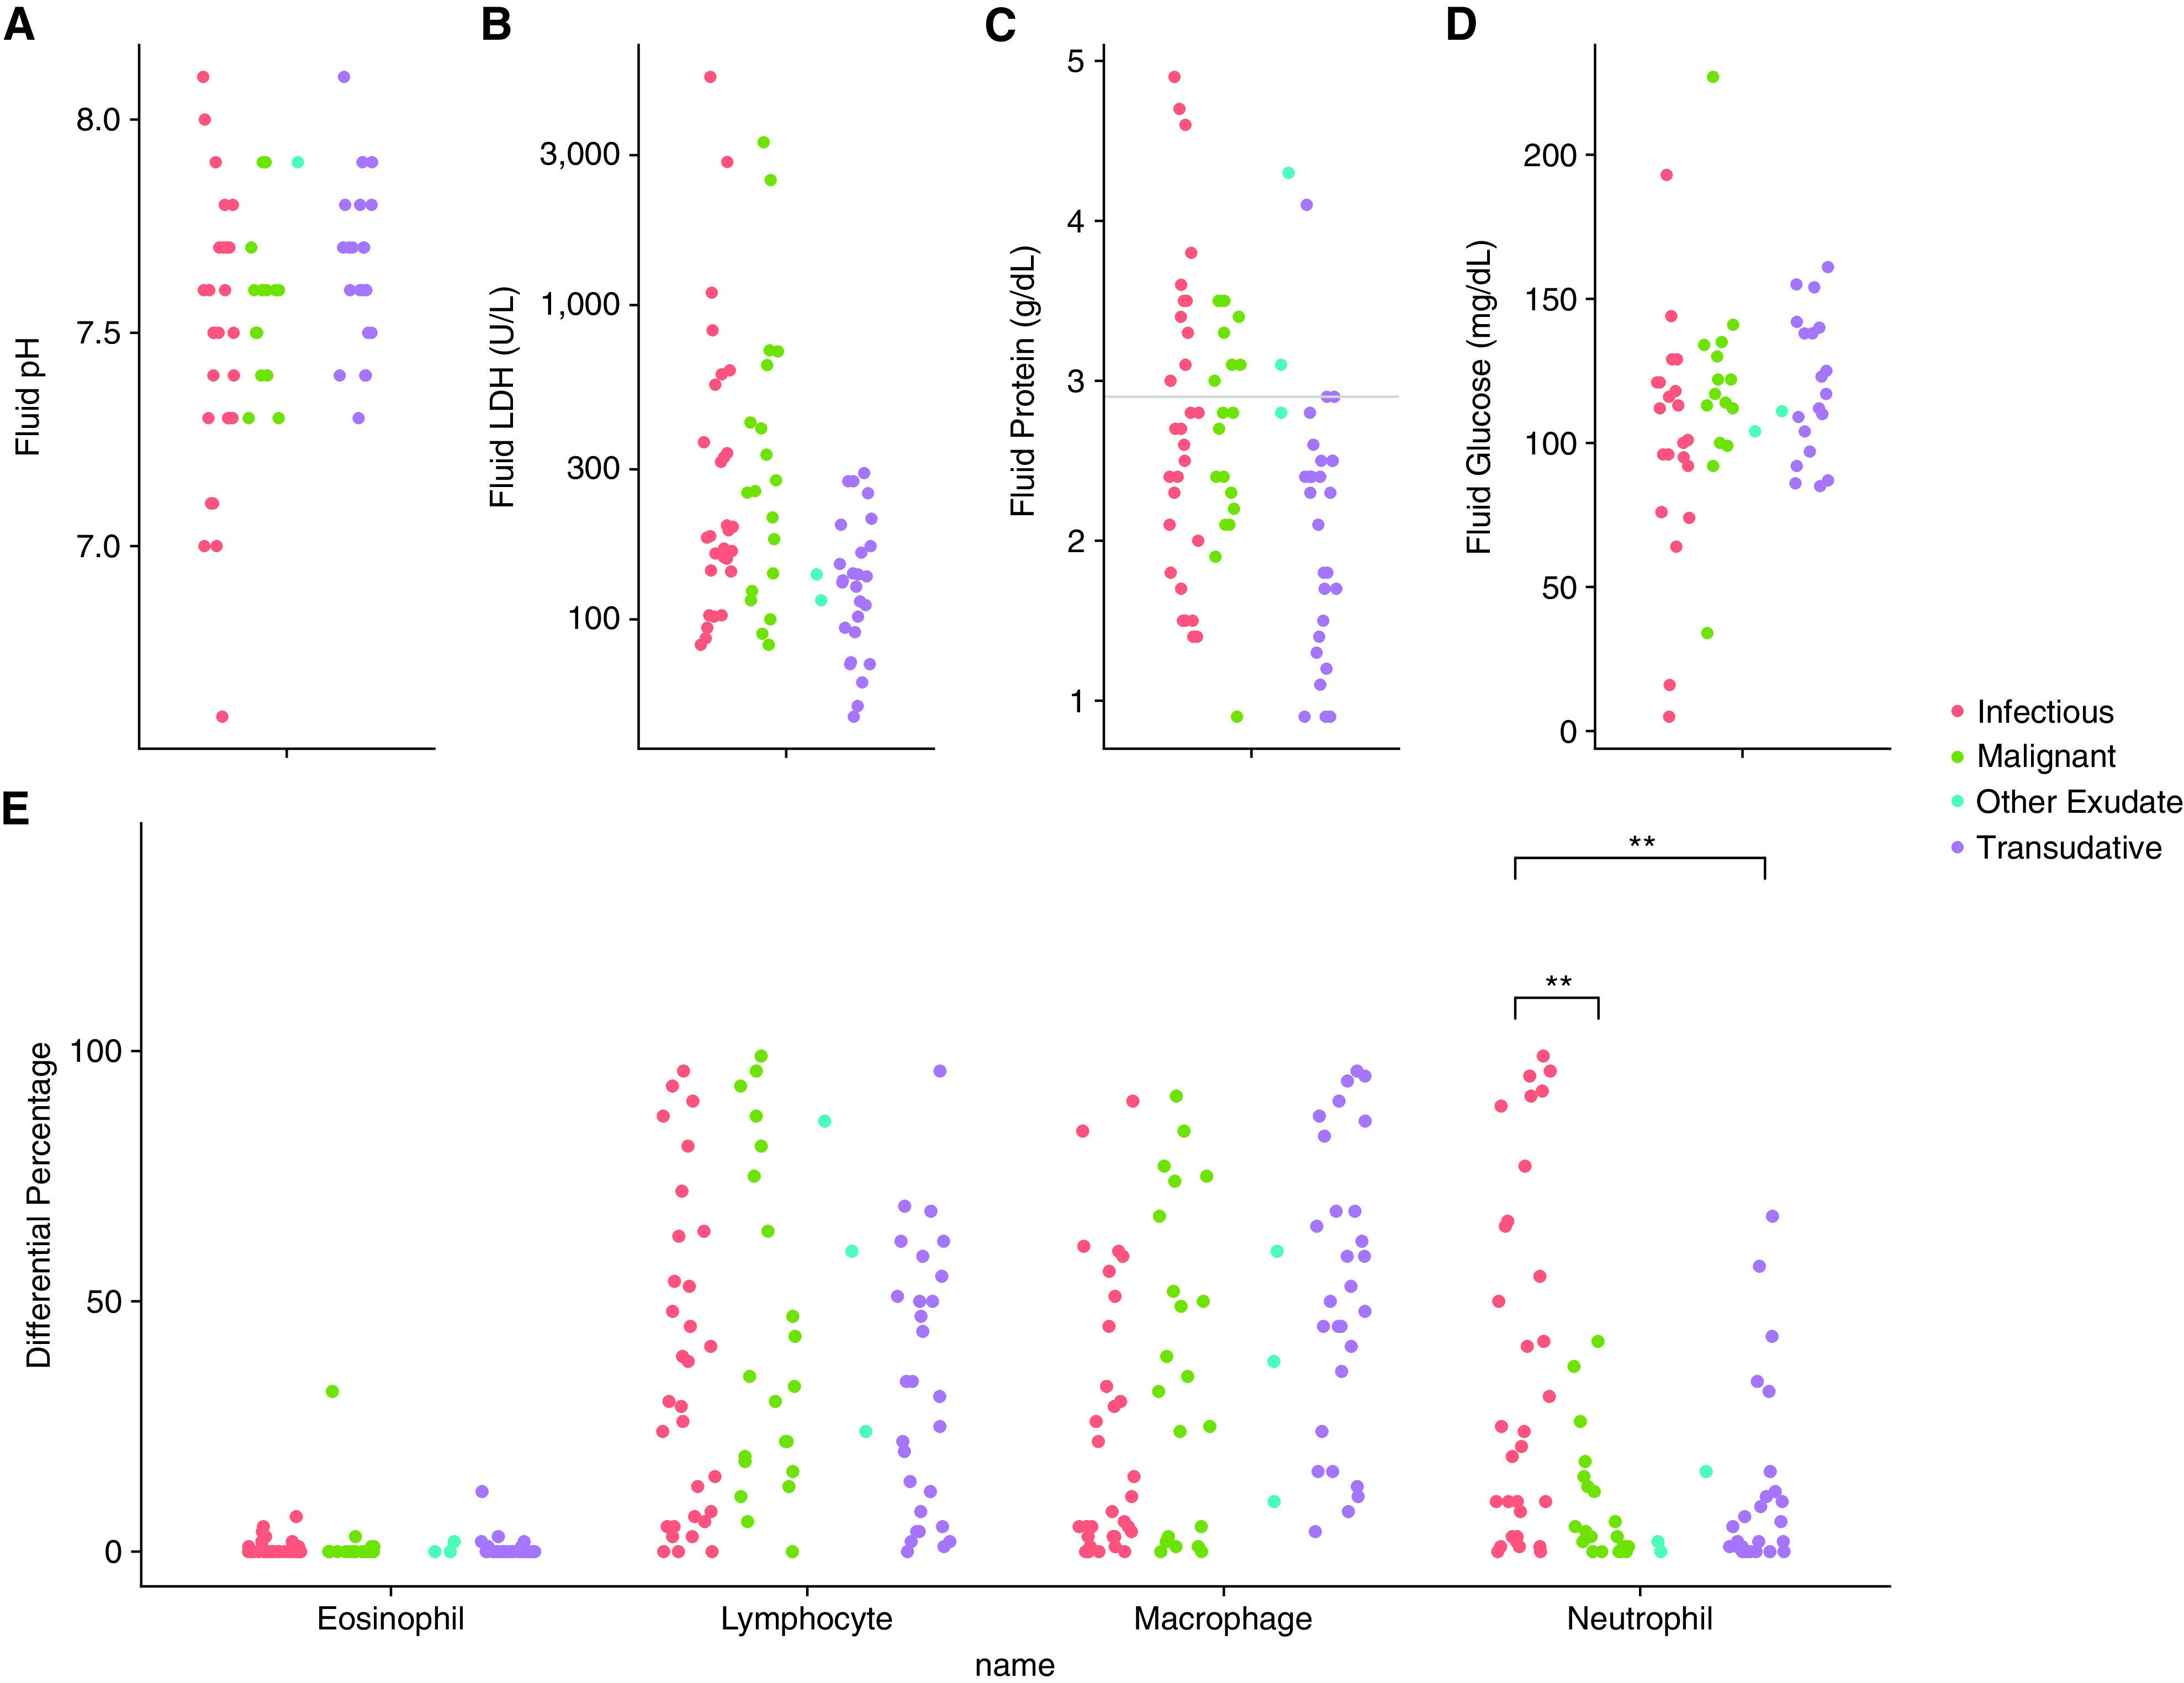
Figure 1.

Neutropenic pleural fluid laboratory results. (A–D) Comparison of fluid pH, LDH, protein, and glucose, respectively, between all four case categories. Horizontal line in (C) represents pleural fluid protein 2.9 as referenced in Table 1. (E) Comparison of fluid cell profile between all four case categories. **P value determined by Bonferroni correction with familywise error rate of 0.05. LDH = lactate dehydrogenase.
