FIGURE 2.

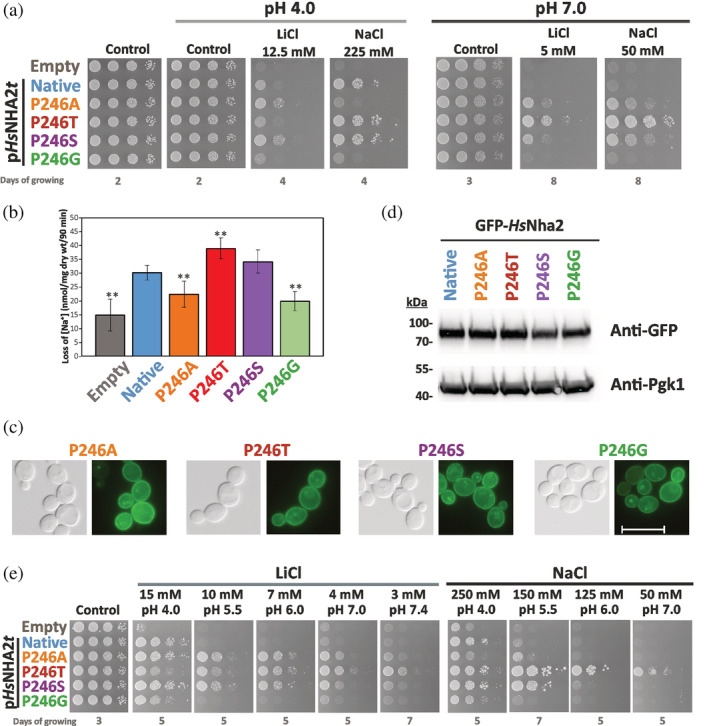
Characterization of HsNHA2 with point mutations at proline 246. (a) Salt tolerance of S. cerevisiae BW31 cells containing empty vector or expressing native HsNHA2 or one of four HsNHA2 versions with single point mutations P246A, T, S or G from pHsNHA2t plasmid. Cells were grown on YNB‐Pro or non‐buffered YNB‐Pro plates with pH adjusted to 4.0 or 7.0 and supplemented with LiCl or NaCl as indicated. Plates were incubated at 30°C and photographed on the indicated day. (b) Loss of Na+ from same cells as described in (a). Cells were grown in YNB‐Pro media, preloaded with Na+, transferred to Na+‐free incubation buffer at pH 4.0 and changes in the intracellular Na+ content were estimated as described in Section 5. Columns show the amount of Na+ lost from cells within 90 min. Data represent the mean of at least 5 replicate values ± SD. Significant differences compared to cells expressing the native HsNHA2 are indicated with asterisks (**p < .01). Localization (c) and immunodetection (d) of N‐terminal GFP‐tagged HsNHA2 with single point mutations at Pro246. BW31 cells expressing variants of GFP‐HsNHA2 from pGFP‐HsNHA2t were grown in YNB‐Pro (4% glucose) to the exponential phase and observed under a fluorescence microscope (c, right). A Nomarski prism was used for whole‐cell imaging (c, left). In (d), protein extracts of cells were prepared as described in Section 5, subjected to SDS‐PAGE (10% gel) and transferred to a nitrocellulose membrane. Native GFP‐HsNHA2 and its variants were detected with an anti‐GFP antibody. The membrane was reprobed and incubated with an anti‐Pgk1 antibody to verify the amount of loaded proteins. (e) Activity of mutated HsNHA2 antiporters at various extracellular pH was determined by growth of cells on YNB‐Pro plates buffered to various pH levels (4.0–7.4) and supplemented with LiCl or NaCl as indicated. Images were taken on the indicated day of incubation at 30°C
