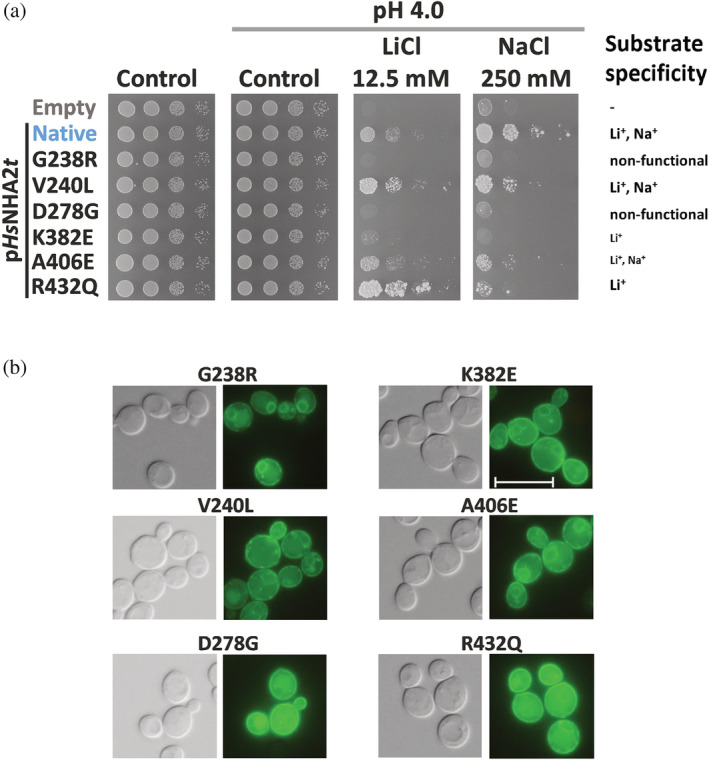
FIGURE 5.

Phenotypes of SNPs of HsNHA2. (a) Salt tolerance of S. cerevisiae BW31 cells containing empty vector or expressing native HsNHA2 or one of six HsNHA2 mutated versions—G238R, V240L, D278G, K382E, A406E, and R432Q from the pHsNHA2t plasmid. Cells were grown on YNB‐Pro or non‐buffered YNB‐Pro plates with pH adjusted to 4.0 and supplemented with LiCl or NaCl as indicated. Growth was monitored for 2 (controls) or 7 (LiCl or NaCl) days at 30°C. (b) Localization of N‐terminal GFP‐tagged HsNHA2 versions. BW31 cells expressing GFP‐HsNHA2 with single point mutations as in (a) from pGFP‐HsNHA2t were grown in YNB‐Pro (4% glucose) to the exponential phase and observed under fluorescence microscope (b, right). A Nomarski prism was used for whole‐cell imaging (b, left). The scale bar corresponds to 10 μm
