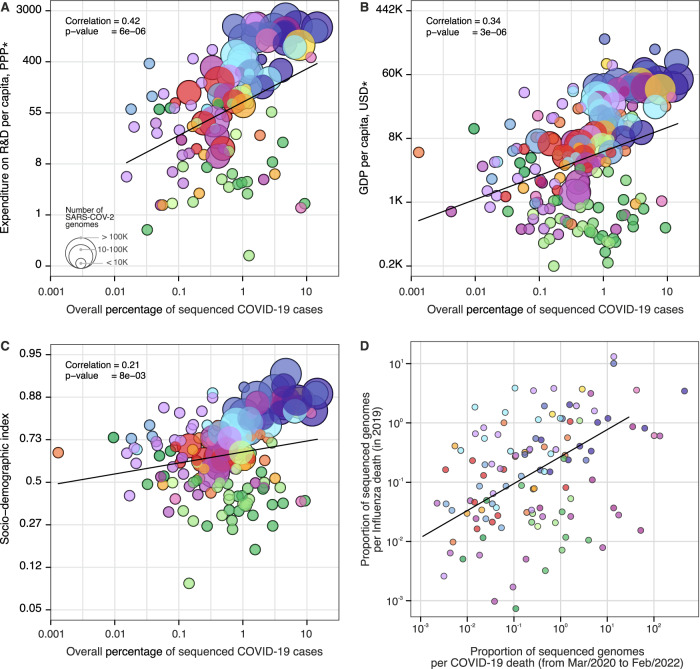
Fig. 4. Case sequencing percentages and socioeconomic covariates.
Covariates that show the highest correlation with the overall percentage of COVID-19 sequenced cases (during the period shown in Fig. 1, with geographic regions colored as shown in that figure). A Expenditure on R&D per capita (slope = 1.30, CI = (0.76, 1.84), t-value = 4.76). B GDP per capita (slope = 0.75, CI = (0.44, 1.05), t-value = 4.83). C Socio-demographic index (slope = 0.25, CI = (0.07, 0.44), t-value = 2.70). D Overall proportion of sequenced genomes per influenza death in 2019 (HA segment) (slope = 0.89, CI = (0.40, 1.37), t-value = 3.62). For correlations between covariates and turnaround time, see Fig. S10. The color scheme is the same as in Figs. 1 and 2. Solid line shows the linear fit; correlation is Pearson’s correlation; p values are reported based on the t-statistic using two-sided hypothesis, with the null hypothesis being that the slope of the linear trend is zero. There was no need for multiple comparison adjustments. *PPP purchasing power parity, USD US dollar 2005.

