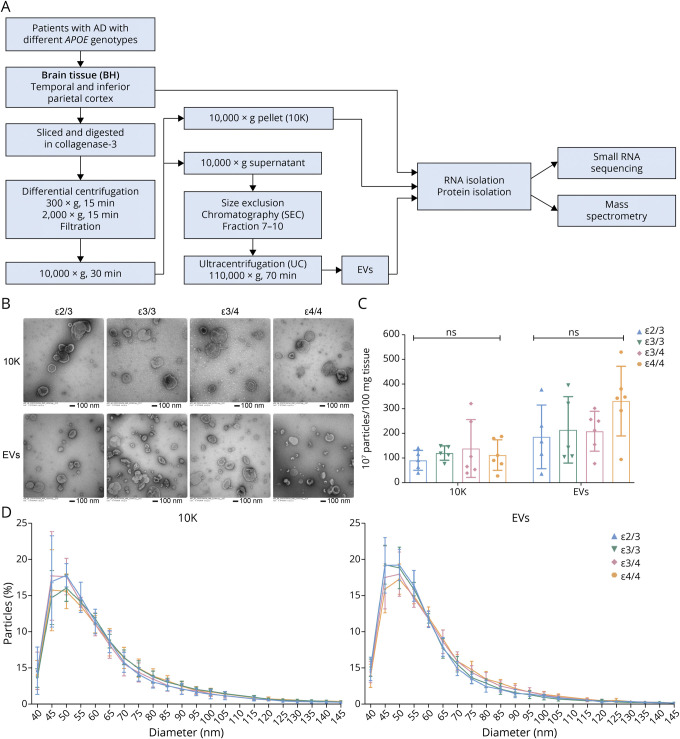
Figure 1. bdEV Enrichment and Characterization From AD Patients With Different APOE Genotypes.
(A) Workflow for bdEV enrichment, small RNA sequencing, and proteomics. After digestion, centrifugation, and filtration steps, 10,000g pellets were collected and defined as the 10K fraction. SEC was applied to 10,000g supernatants to enrich bdEVs. RNA and proteins from BH, 10K, and bdEVs were then isolated and subjected to small RNA sequencing and mass spectrometry. (B) 10K and bdEVs from AD brain tissues with different APOE genotypes (ε2/3, ε3/3, ε3/4, and ε4/4) were visualized by negative staining TEM (scale bar = 100 nm). TEM is representative of 10 images taken of each fraction from 5 independent human tissue samples. (C) Particle concentrations of 10K and EV fractions of AD patients with different APOE genotypes were measured by nanoFCM flow nanoAnalyzer. Particle concentration for each group was normalized by tissue mass (per 100 mg). (D) Size distributions of 10K and EV fractions of AD patients with different APOE genotypes were measured by nanoFCM flow nanoAnalyzer and calculated as particles in a specific size bin vs total detected particles in each sample (percentage). Data are presented as mean ± SD. ns: no significant difference (p > 0.05) between the 2 APOE genotype groups by the 2-tailed Welch t test. AD = Alzheimer disease; bdEVs = brain-derived EVs; SEC = size-exclusion chromatography; TEM = transmission electron microscopy.

