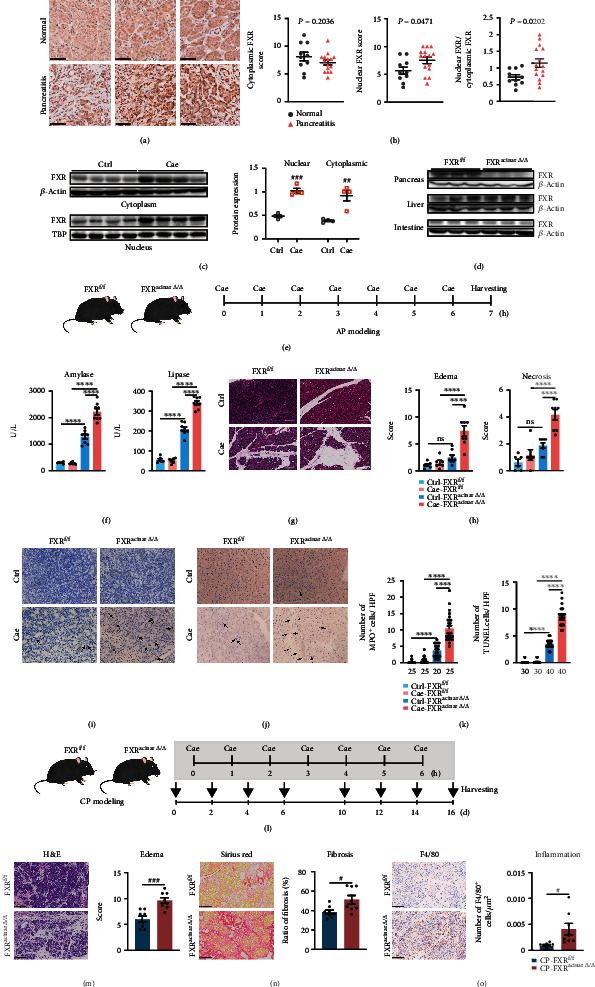
Figure 1.

Nuclear FXR level was elevated in pancreatitis and deletion of pancreatic acinar FXR led to more severe pancreatitis. (a) Representative images of FXR immunohistochemical staining from three pancreatitis tissues and three normal pancreatic tissues in human patients. Scale bars, 50 μm. (b) Scoring for the FXR levels in cytoplasm and nucleus of human pancreatic tissues as well as the ratio of nuclear and cytoplasmic FXR scores (normal tissues, n = 10; pancreatitis tissues, n = 15). (c) Immunoblot and its statistics of nuclear and cytoplasmic FXR in pancreatitis tissues and normal tissues from mice. (d) Immunoblot of FXR in pancreas, liver, and intestine from FXRf/f and FXRacinarΔ/Δ mice. (e) Schedule for AP modeling in FXRf/f and FXRacinarΔ/Δ mice. (f) Serum amylase and serum lipase levels of FXRf/f and FXRacinarΔ/Δ mice with or without caerulein challenge. (g) Representative H&E images of the pancreas of FXRf/f and FXRacinarΔ/Δ mice with or without caerulein challenge. Scale bars, 100 μm. (h) Evaluation for tissue edema and necrosis in the pancreas (FXRf/f and FXRacinarΔ/Δ mice treated with saline: n = 6; FXRf/f and FXRacinarΔ/Δ mice treated with caerulein: n = 8). (i, j) Representative images of MPO (i) and TUNEL (j) immunostaining of pancreatic tissues from each group. Scale bars, 20 μm. (k) Statistics plot was performed the number of MPO and TUNEL-positive acinar cells per high-power field (HPF). Five HPFs per individual. The number of HPFs used for the summarized plots of MPO and TUNEL immunostaining are indicated. (l) Schedule for CP modeling in FXRf/f and FXRacinarΔ/Δ mice. (m) Representative images of H&E staining and tissue edema scoring of pancreatic tissues from repeated caerulein-challenged FXRf/f (n = 8) and FXRacinarΔ/Δ (n = 8) mice. Scale bars, 250 μm. (n) Representative images of Sirius Red staining and evaluation of fibrosis of pancreatic tissues. Scale bars, 50 μm. (o) Representative images of F4/80 immunostaining and number of F4/80+ cells/μm2 of pancreatic tissues. Scale bars, 100 μm. Data are presented as the mean ± SEM. #P < 0.05, ##P < 0.01, and ###P < 0.001 via unpaired Student's T test. ∗∗∗∗P < 0.0001 via one-way ANOVA. ns: not significant.
