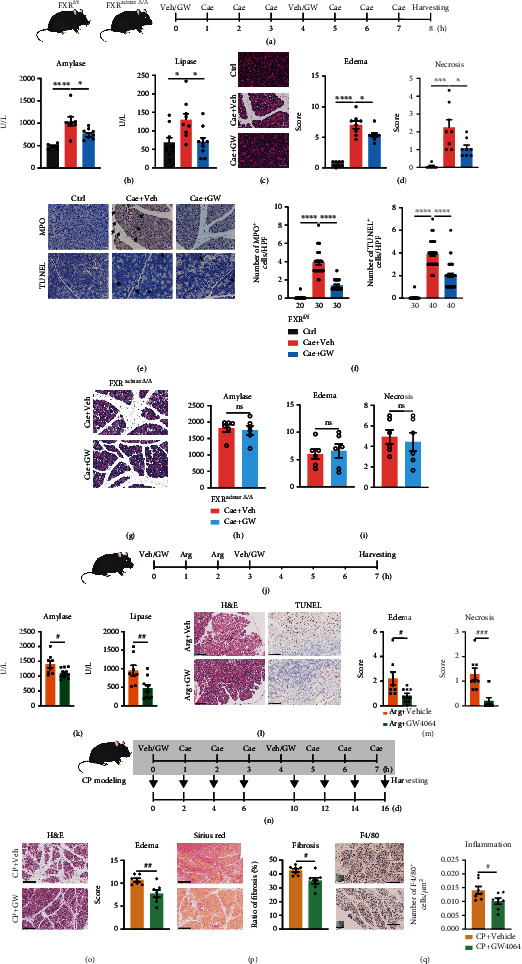
Figure 2.

Administration of FXR agonist GW4064 in mice alleviated pancreatitis. (a) Scheme for GW4064 administration in caerulein-induced pancreatitis murine models. (b) Serum amylase levels of mice treated with saline + vehicle (n = 6), caerulein + vehicle (n = 8), or caerulein + GW4064 (n = 9). (c) Representative H&E images of pancreatic tissues. (d) Scoring for pancreatic tissue edema and necrosis (mice treated with saline + vehicle: n = 6; mice treated with caerulein + vehicle: n = 8; mice treated with caerulein + GW4064: n = 8). (e) Representative images of MPO and TUNEL immunostaining of pancreatic tissues. Scale bars, 20 μm. (f) Statistics for the number of MPO and TUNEL-positive acinar cells per HPF. Five HPFs per individual. The number of HPFs used for the summarized plots of MPO and TUNEL immunostaining are indicated. (g) Representative H&E images of pancreatic tissues from FXRacinarΔ/Δ mice treated with caerulein. Scale bars, 20 μm. (h, i) Serum amylase levels (h) and scoring for tissue edema and necrosis (i) of FXRacinarΔ/Δ mice treated with caerulein. n = 6 in each group. (j) Scheme for GW4064 administration in L-arginine-induced AP murine models. (k) Serum amylase and lipase levels of mice treated with L − arginine + vehicle (n = 8) or L − arginine + GW4064 (n = 10). (l) Representative images of H&E staining and TUNEL immunostaining of pancreatic tissues. Scale bars, 100 μm. (m) Scoring for pancreatic tissue edema and necrosis (mice treated with L − arginine + vehicle, n = 8. Mice treated with L − arginine + GW4064, n = 10). (n) Scheme for GW4064 administration in repeated caerulein injection-induced CP murine models. (o) Representative images of H&E staining and tissue edema scoring of pancreatic tissues from repeated caerulein-challenged mice treated with vehicle (n = 7) or GW4064 (n = 7). Scale bars, 250 μm. (p) Representative images of Sirius Red staining and evaluation of fibrosis of pancreatic tissues. Scale bars, 250 μm. (q) Representative images of F4/80 immunostaining and number of F4/80+ cells/μm2 of pancreatic tissues. Scale bars, 250 μm. Data are presented as the mean ± SEM. ∗P < 0.5, ∗∗∗P < 0.001, and ∗∗∗∗P < 0.0001 via one-way ANOVA. #P < 0.05, ##P < 0.01, and ###P < 0.001 via unpaired Student's T test. ns: not significant.
