Figure 3.

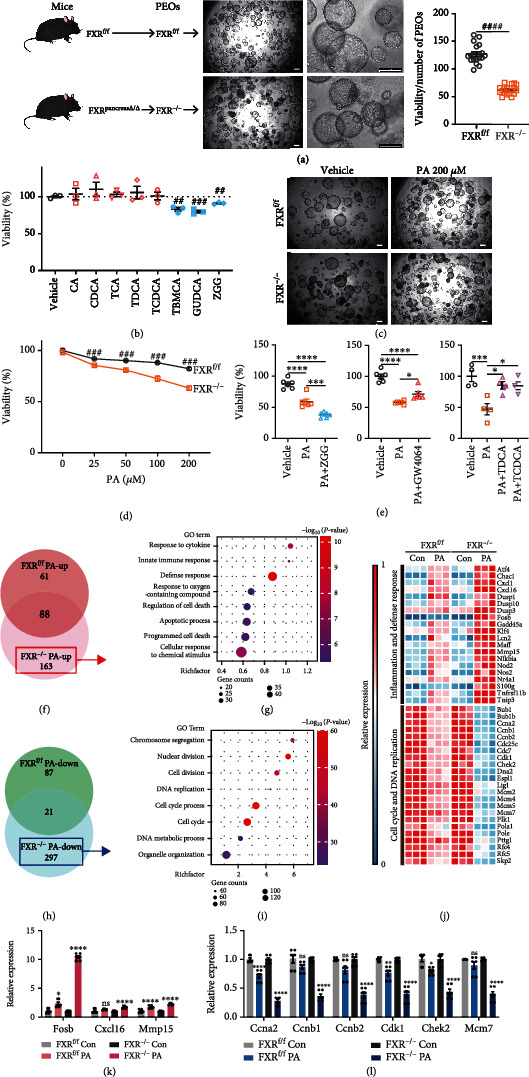
FXR deletion compromised the viability and stress tolerance of PEOs. (a) PEOs were initiated from mice and observed by microscopy. Representative images and the ratio of viability to number of FXRf/f and FXR−/− PEOs were performed. Scale bars, 200 μm. (b) Viability of PEOs treated with 10 μM CA, CDCA, TCA, TDCA, TCDCA, T-βMCA, GUDCA, and ZGG. (c) Representative microscopy images of FXRf/f or FXR−/− PEOs upon vehicle or PA treatment. Scale bars, 200 μm. (d) Viability of FXRf/f and FXR−/− PEOs treated with PA at different concentrations. Viability was normalized to vehicle group values. (e) Viability of PEOs under PA challenge treated with ZGG, GW4064, TDCA, and TCDCA. (f) Venn analysis between upregulated genes in FXRf/f and those in FXR−/− PEOs upon PA stress. (g) GO enrichment of genes upregulated in FXR−/− but not in FXRf/f PEOs by PA treatment. (h) Venn analysis between downregulated genes in FXRf/f and those in FXR−/− PEOs upon PA stress. (i) GO enrichment of genes downregulated in FXR−/− but not in FXRf/f PEOs by PA treatment. (j) Heatmap of genes related to inflammation, defense response, cell cycle, and DNA replication changed by PA stress in FXRf/f PEOs and showed more prominent changes in FXR−/− PEOs than those in FXRf/f PEOs. (k, l) RT-qPCR analysis of inflammation-related genes (Fosb, Cxcl16, and Mmp15) and cell cycle-related genes (Ccna2, Ccnb1, Ccnb2, Cdk1, Chek2, and Mcm7). ns: not significant. ##P < 0.01, ###P < 0.001, and ####P < 0.0001 via unpaired Student's t test. ∗P < 0.5, ∗∗∗P < 0.001, and ∗∗∗∗P < 0.0001 via one-way ANOVA.
