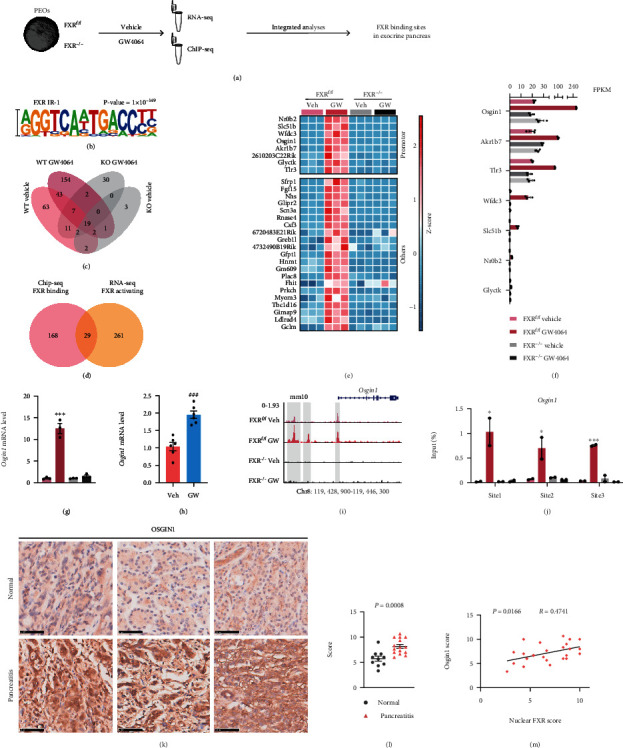
Figure 4.

Osgin1 was transcriptionally upregulated by FXR activation in PEOs and OSGIN1 level was elevated in human pancreatitis tissues. (a) Study design. (b) The top represented de novo motifs in FXR in GW4064-treated FXRf/f PEOs. (c) Venn analysis among peaks called from the four groups. (d) Venn analysis between genes with FXR binding from ChIP-seq analysis and genes upregulated by FXR activation from RNA-seq analysis. (e) Heatmap of genes transcriptionally activated by FXR. (f) FPKM values of genes, which were bound by FXR at their transcription start site (TSS) and promoter regions. (g) qPCR analysis of Osgin1 expression in FXRf/f or FXR−/− PEOs treated with or without GW4064. (h) qPCR analysis of Osgin1 expression in pancreatic tissues of mice treated with or without GW4064. (i) FXR binding sites in the Osgin1 upstream sequence are highlighted. (j) ChIP-qPCR validation of FXR binding sites in the Osgin1 upstream sequence. (k) Representative images of OSGIN1 IHC staining in three pancreatitis tissues and three normal tissues. Scale bars, 50 μm. (l) Scoring for the OSGIN1 levels in human pancreatic tissues (normal tissues, n = 10; pancreatitis tissues, n = 15). (m) Correlation between nuclear FXR score and OSGIN1 score. Data are presented as the mean ± SEM. ns: not significant. ∗∗P < 0.01 and ∗∗∗P < 0.001 via one-way ANOVA compared with WT vehicle group.
