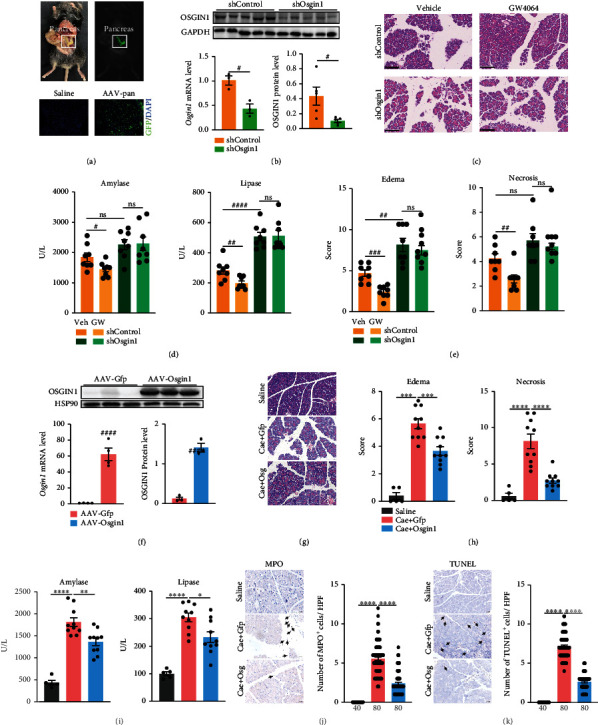
Figure 5.

Osgin1 mediated the protective effects of FXR activation on pancreatitis. (a) Representative in vivo fluorescent imaging of GFP in pancreas of mice after AAV-pan transduction and frozen slices of GFP in pancreatic tissue from mice with AAV-pan transduction. Scale bars, 100 μm. (b) Confirmation of Osgin1 knockdown by RT-qPCR and immunoblots analysis. (c) Representative images of H&E staining in pancreatic tissues. Scale bars, 100 μm. (d) Serum amylase and lipase levels of caerulein challenged mice in four groups (shControl + vehicle, n = 8; shControl + GW4064, n = 8; shOsgin1 + vehicle, n = 8; shOsgin1 + GW4064, n = 8). (e) Scoring for tissue edema and necrosis. (f) Confirmation of Osgin1 overexpression by RT-qPCR and immunoblots analysis. (g) Representative images of H&E staining in pancreatic tissues. Scale bars, 20 μm. (h) Scoring for tissue edema and necrosis in three groups (saline, n = 5; caerulein + AAV − Gfp, n = 10; caerulein + AAV − Osgin1, n = 10). (i) Serum amylase and lipase levels of mice in four groups. (j) Representative images of MPO immunostaining and its statistics plot. Scale bars, 20 μm. (k) Representative images of TUNEL immunostaining and its statistics plot. Scale bars, 20 μm. Five HPFs per individual. The number of HPFs used for the summarized plots of MPO and TUNEL immunostaining is indicated. Data represent the mean ± SEM. #P < 0.05, ##P < 0.01, ###P < 0.001, and ####P < 0.0001 via unpaired Student's t test. ∗P < 0.5, ∗∗P < 0.01, and ∗∗∗∗P < 0.0001 via one-way ANOVA. ns: not significant.
