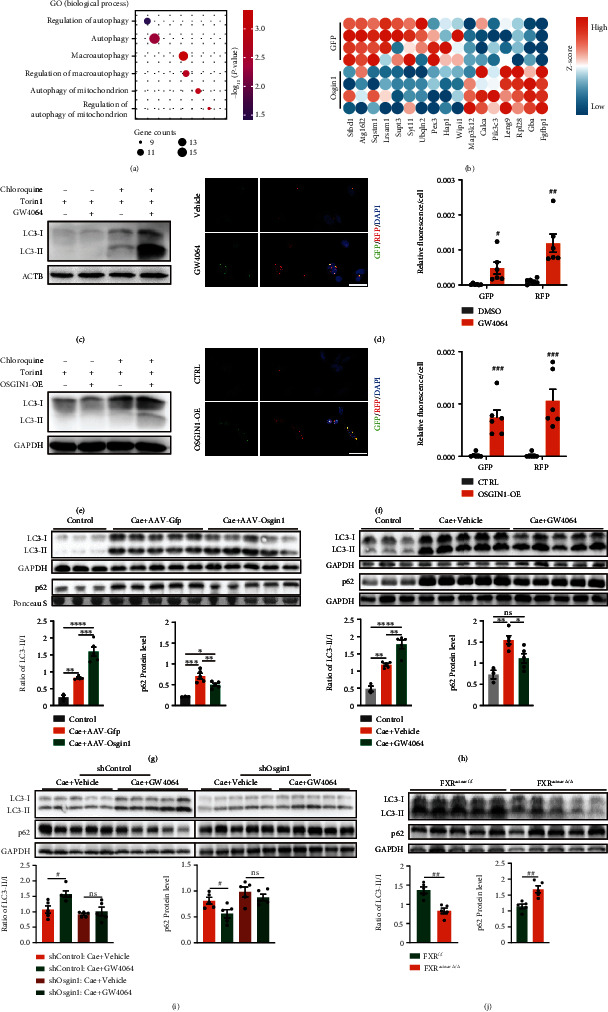
Figure 6.

FXR enhanced restored efficient autophagy via enhancing Osgin1 expression in pancreatitis. (a) GO enrichment of genes changed by Osgin1-overexpression. Plot represented autophagy-related biological process. (b) Heatmap of autophagy-related genes changed by Osgin1-overexpression. (c) Representative immunoblot images of LC3I/II in SW1990 cells changed by GW4064 treatment. (d) Representative images and statistics plot of GFP and RFP puncta in SW1990 cells changed by GW4064 treatment. (e) Representative immunoblots images of LC3I/II in SW1990 cells changed by OSGIN1 overexpression (OSGIN1-OE). (f) Representative images and statistics plot of GFP and RFP puncta in SW1990 cells changed by OSGIN1-OE. (g) Representative western blot images and summarized plot of p62 protein levels as well as the ratio of LC3-II to LC3-I in pancreatic tissues from mice treated with saline (n = 3), caerulein + AAV − pan − CMV − Gfp (n = 5), or caerulein + AAV − pan − CMV − Osgin1 (n = 5). (h) Representative western blot images and summarized plot of p62 protein levels as well as the ratio of LC3-II to LC3-I in pancreatic tissues from mice treated with saline + vehicle (n = 3), caerulein + vehicle (n = 5), or caerulein + GW4064 (n = 5). (i) Representative western blot images and summarized plot of p62 protein levels as well as the ratio of LC3-II to LC3-I in pancreatic tissues from caerulein challenged mice treated with AAV − shControl + vehicle (n = 5), AAV − shControl + GW4064 (n = 5), AAV − shOsgin1 + vehicle (n = 5), and AAV − shOsgin1 + GW4064 (n = 5). (j) Representative western blot images and summarized plot of p62 protein levels as well as the ratio of LC3-II to LC3-I in pancreatic tissues from FXRf/f (n = 5) and FXRacinarΔ/Δ (n = 5) mice treated with caerulein. Data are presented as the mean ± SEM. ns: not significant. ∗P < 0.5, ∗∗P < 0.01, ∗∗∗P < 0.001, and ∗∗∗∗P < 0.0001 via one-way ANOVA. #P < 0.01 and ##P < 0.01 via unpaired Student's t test.
